Production Line Efficiency – How to Measure It and Which Manufacturing KPIs Actually Matter
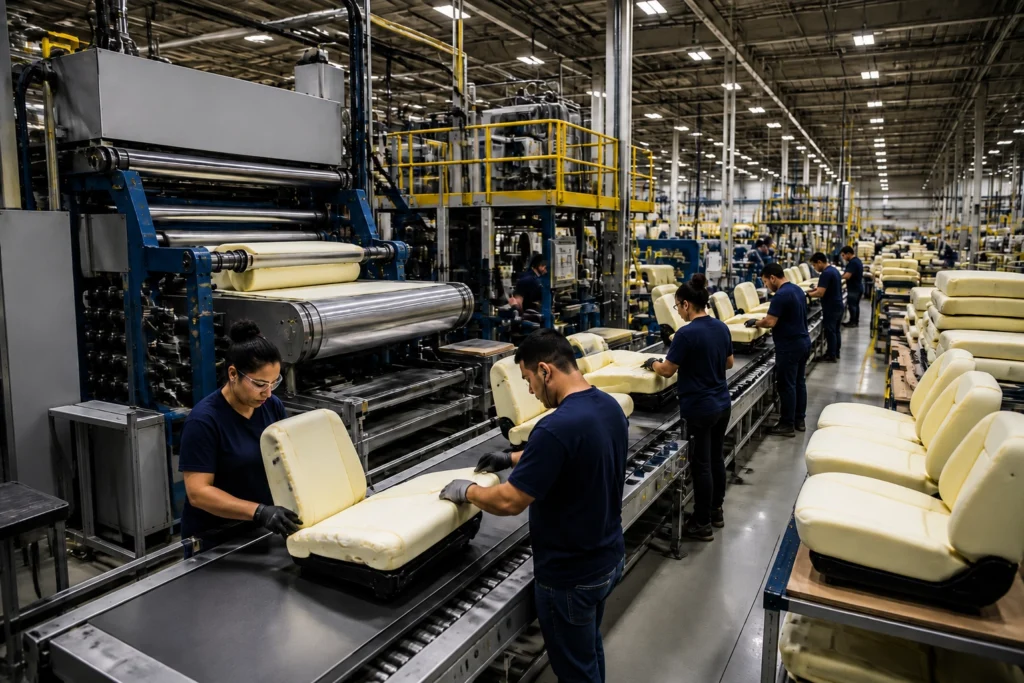
If you work on a production floor, this situation probably sounds familiar. The line is running, operators are at their stations, and production seems to follow the plan. At least that’s the impression.
Then, at the end of the shift, comes the surprise: the number of finished units is lower than expected.
At that moment, production managers usually ask the same question: Where did the production line efficiency go?
In most cases, the cause is not a single major problem but many small events. A few minutes of downtime, a short drop in machine speed, or a brief stop to fix a minor issue. Each one looks harmless on its own, but across an entire shift they can add up to hundreds of missing units.
That is why it helps to look at production through specific metrics. Data shows what is actually happening on the line.
In this article you will learn:
- what production line efficiency means
- how to calculate machine efficiency
- which manufacturing KPIs are worth tracking
- examples of KPIs commonly used in factories
- how these metrics lead to machine efficiency analysis, including OEE
What Is Production Line Efficiency
In simple terms, production line efficiency shows how many products are made within a certain time compared to the production capacity of the line.
In practice, this means comparing two numbers:
- planned production
- actual production
If the plan assumed 1000 units, but the counter shows 830 units at the end of the shift, part of the production capacity was not used.
There can be many reasons. On most production lines, the most common are:
- short machine stops
- slower production speed
- quality issues
- long changeovers
- lack of materials
Many of these events last only a few minutes and do not always appear in production reports. The operator fixes the issue and the line starts again. A few hours later, the production result no longer matches the plan.
That is why measuring production efficiency is one of the first steps toward understanding how the line actually performs.

How to Calculate Machine Efficiency
If you want to improve production efficiency, you first need to calculate it. Two methods are used most often.
Method 1 – Comparing Planned and Actual Production
The simplest approach compares the production plan with the actual output.
Formula
machine efficiency = (actual production / planned production) × 100%
Example
production plan: 1000 units | actual production: 850 units
Calculation
850 / 1000 × 100% = 85%
This result shows that the machine used 85% of its production capacity.
This method is simple and often appears in production reports. The downside is that it shows the result but does not always explain why efficiency dropped.
Method 2 – Based on Cycle Time
The second method helps determine whether the machine runs at the expected speed.
Formula
efficiency = (number of produced units × ideal cycle time) / available production time
Example
ideal cycle time: 5 seconds
production: 600 units
working time: 3600 seconds
Calculation
600 × 5 = 3000
3000 / 3600 = 83%
This clearly shows that the machine operated slower than the technological standard.
These calculations provide a starting point for monitoring machine performance and analyzing production.

See how you can increase production line efficiency in your factory.
Understanding how production line efficiency is measured and how to view it as a whole is the first step.
Let’s talk about how we can help you collect and visualize production data so efficiency measurement becomes reliable and easy to use.
Manufacturing KPIs – Why They Matter
Efficiency alone is not enough to manage production effectively. A production line is a system made of many connected elements. To understand how a factory performs, several metrics are needed.
This is where manufacturing KPIs come in.
They help you see:
- where the longest downtimes occur
- whether machines run at the expected speed
- whether product quality remains stable
- whether the production plan is being met
Production metrics give you a broader view of manufacturing. Without them, many decisions rely only on observations from the production floor or team experience.
Manufacturing KPI Examples Used in Practice
The list of KPIs can be long. In practice, a small set of metrics already helps identify most production problems.
| Manufacturing KPI | What it Shows | Why It Matters |
| Production line efficiency | comparison of planned and actual output | quick view of shift performance |
| Output per hour | production speed | allows comparison between shifts |
| Downtime | time when the machine is not producing | shows the largest time losses |
| Defect rate | share of defective products | indicates quality level |
| Changeover time | time required to switch production | affects available production time |
| Production plan completion | whether production meets demand | important for planning |
Even this small set of metrics gives a clear picture of how production is running.
From Production Metrics to OEE
When you start measuring efficiency, downtime, and quality, you may want to see the overall performance of production equipment.
That is where the OEE (Overall Equipment Effectiveness) indicator becomes useful.
OEE combines three elements:
- machine availability
- production performance
- product quality
The data needed to calculate OEE often already exists in a factory. In many cases it is stored in different reports or spreadsheets.
When data is collected directly from machines, it becomes much easier to see the real performance of production and respond quickly when problems appear.
Common Mistakes When Measuring Production Efficiency
Measuring production does not always reflect the real situation on the line.
One common problem is ignoring short downtimes. If a machine stops for a few minutes several times during a shift and these stops are not recorded, the report will show higher efficiency than the actual performance.
Another frequent issue is using outdated cycle time values. If the technological standard was not updated after process changes, efficiency calculations may be incorrect.
Manual reporting can also cause problems. When operators write down production numbers only at the end of the shift, some information may be lost.
It is also common to analyze only one metric. Production efficiency alone does not show whether the issue comes from downtime, machine speed, or quality.
The best results come from analyzing several KPIs at the same time and collecting production data directly from machines.
How to Monitor Production Efficiency in Practice
Calculating machine efficiency is only the first step. Data becomes more useful when you have access to it during production.
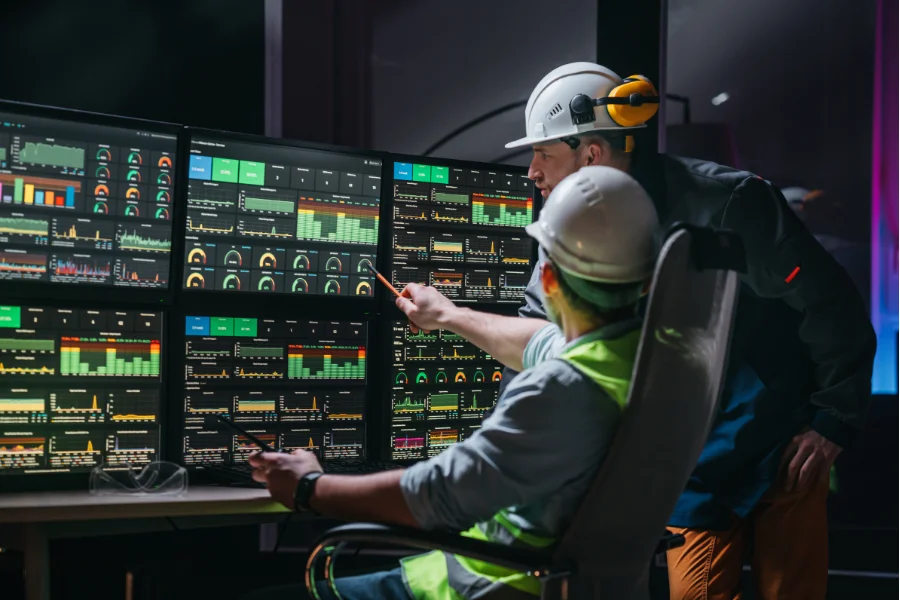
More factories are introducing real-time production monitoring. Data collected directly from machines shows:
- current production speed
- the moment when a machine stops
- downtime duration
- number of produced units
This allows the production manager to react immediately instead of waiting until the end of the shift.
The Value of Production Line Monitoring
Measuring real production efficiency becomes much easier when data is collected from all machines and available continuously.
When this information is accessible in real time, results are closer to the actual situation on the production floor. It also helps teams react faster to performance drops and production problems.

FAQ – Frequently Asked Questions
How do you calculate machine efficiency?
The most common formula is:
efficiency = (actual production / planned production) × 100%
What does production line efficiency mean?
It is a metric that shows how many products are produced within a given time compared to the production capacity of the line.
Which manufacturing KPIs are most important?
The most commonly used metrics include:
- production efficiency
- downtime
- defect rate
- production plan completion
- changeover time