
Respond immediately to production issues with explitia.Andon system
Andon System for Real-Time Response to Production Issues
Do you want to see what is happening on the shop floor right away, how long a status has been active, and who is working at the station?
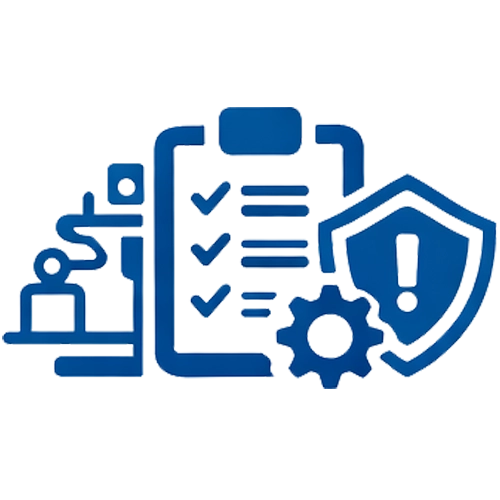
explitia.Andon is an andon system that records and displays the current condition of production stations. It shows the live station status, status duration, logged-in operator, status history, OK/NOK counters, and reports used in day-to-day production management.
It is a good fit for manufacturers that want to spot downtime faster, organize shop floor data, and prepare a reliable base for deeper analysis in OEE.

Don’t miss this opportunity!
Join the waiting list and be among the first to get explitia.Andon completely free of charge! Monitor reports, statuses, and team responses in one place. No communication chaos, no delays, no reacting after the fact.
What explitia.Andon brings to your plant?
On one screen, you can see data that is often scattered across stations, shifts, and end-of-shift reports.
In the module, you gain:
 Current station work status with duration
 Logged-in operator at the station
 Status change history in a timeline view
 Full log of counter changes
 Timeline report
 OK/NOK counters by shift
 Downtime Pareto report
 Detailed tables
 Excel export
 Configuration of stations, statuses, users, and production shifts
Thanks to that, an andon system becomes a tool for daily production work and data review.

An andon system that shows more than a status signal
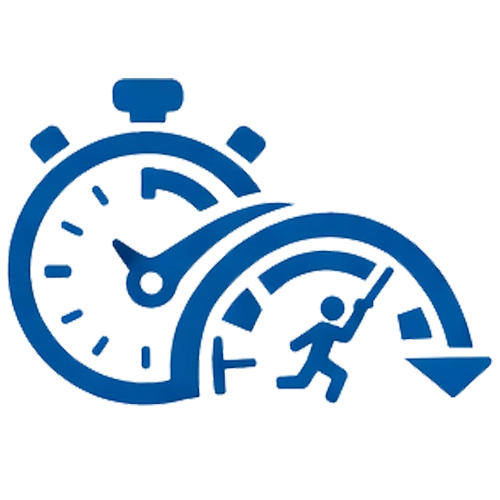
A simple downtime alert is rarely enough. You also need to know when the issue started, who it affects, and how the shift has been running.
On one screen, you can see:
- the live status of every station
- the duration of the current state
- the operator logged in at the station
- shift results for OK and NOK
- status change history
It gives you one clear view of what is happening on the floor and shortens the path from issue detection to response.
Andon board matched to your production process
A well-designed Andon board gives operators, team leaders, and supervisors one shared view. With explitia, you can match that view to your real process instead of forcing your process into a rigid setup.
The board can display:
- current station statuses
- status duration
- operator at the station
- OK/NOK counters for the shift
- status history
- multiple stations at once
Every plant has its own stop reasons, naming, and work rhythm. Your andon system should reflect that. explitia.Andon can be adjusted to the terms and production logic your team already uses.
For plants looking for a simple visual layer on the floor, it can also work as an andon light system. For teams that need quick issue signaling and structured follow-up, it also fits the role of an andon call system.
explitia.Andon records what is actually happening at the station
Work status and duration
The system records the current status of each station and shows how long that state has been active.
You do not just see that a station is down. You also see how long it has been down and whether the same situation keeps coming back.

Logged-in operator
Each station can be tied to the operator currently working there. This makes the shift easier to read and supports better analysis.
Status change history
Every status change is saved in the history. You can check when an issue started, how long it lasted, and which states came before it.

OK/NOK counters and counter change log
The system shows the shift result and the full history of counter changes. That makes it easier to review quality results, corrections, and the full shift flow.
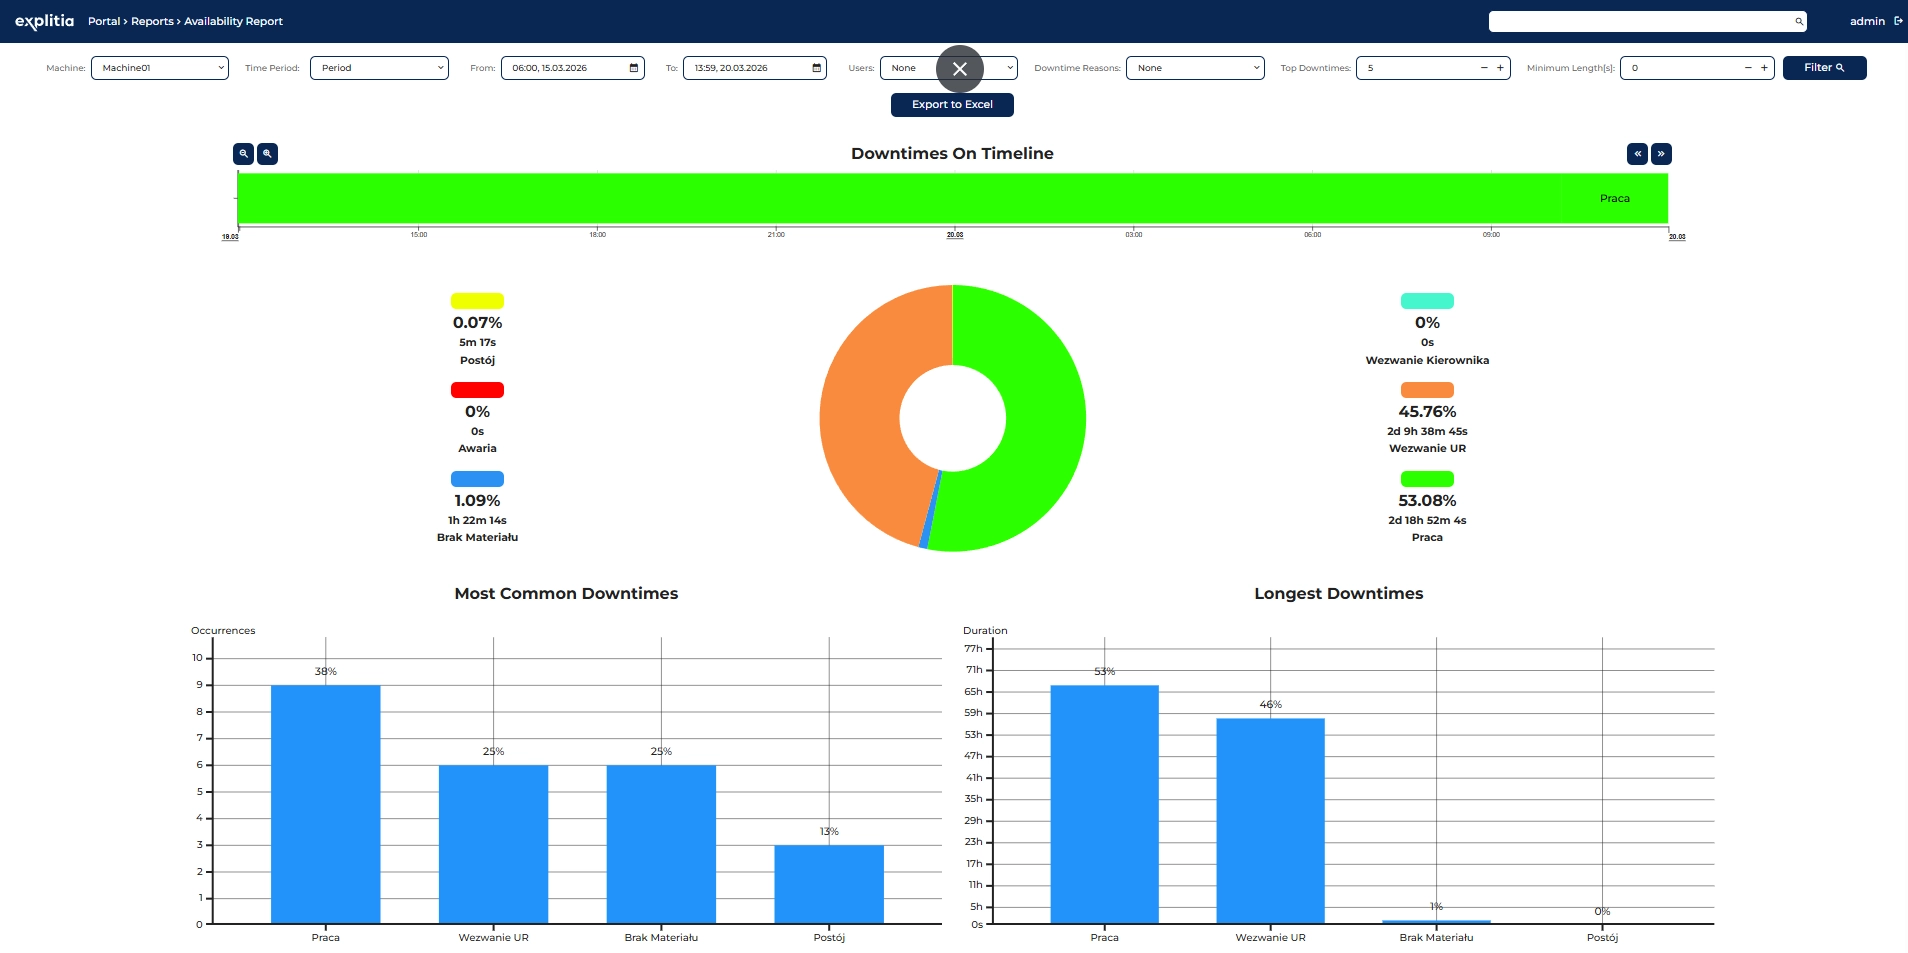
Timeline and reports that organize production data
One of the most useful parts of the module is the status timeline, which shows changes over time in a clear sequence. On one view, you can see when the station was running, when downtime appeared, how long it lasted, and how often the same issue returned.
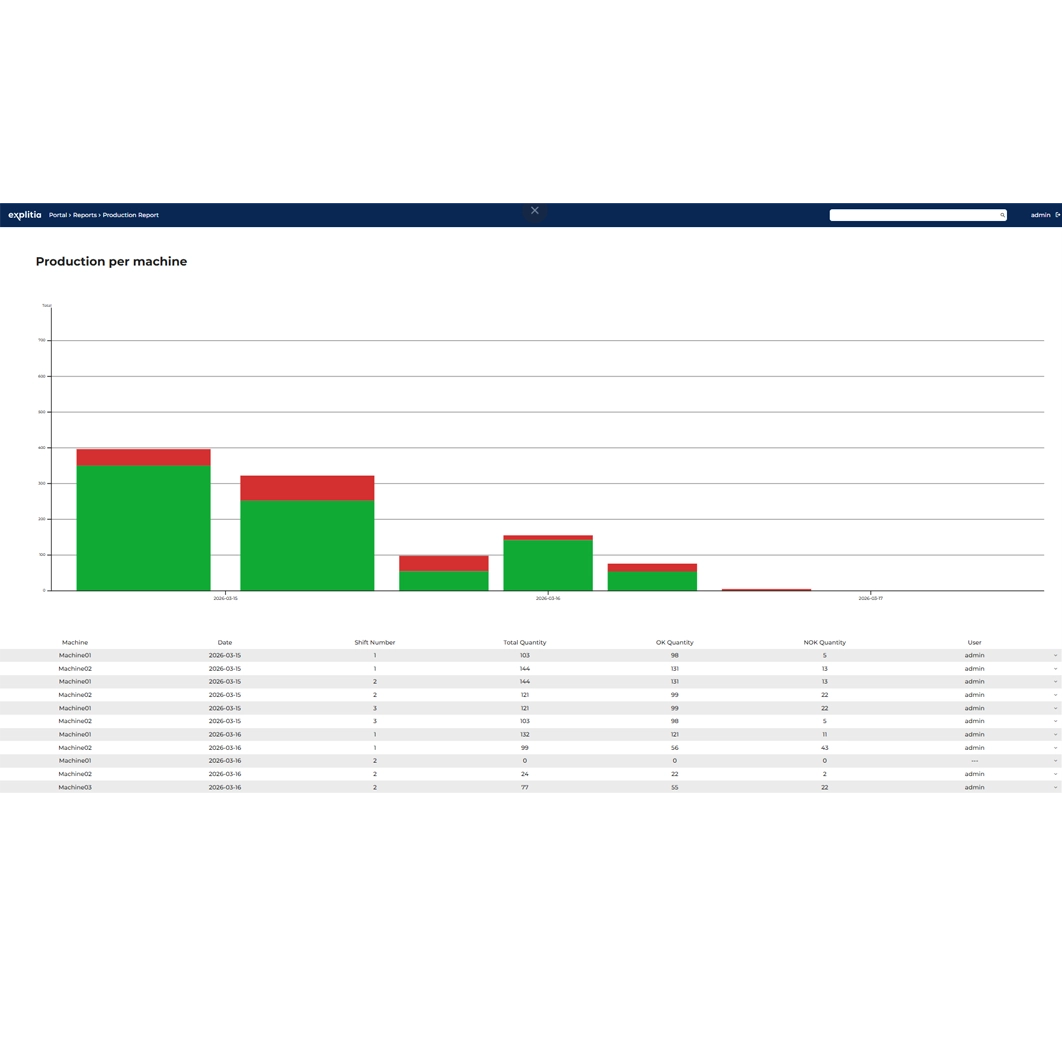
Available reports include:
- status and event timeline
- downtime Pareto
- detailed tables
- Excel export
The Pareto report helps you quickly see the most frequent and longest downtime causes. Detailed tables and Excel export support further review and reporting.
Business value of explitia.Andon
A well-implemented andon system gives you better visibility into station performance and organizes the data needed for daily management.
| For production teams | Faster downtime detection |
| Easier shift oversight | |
| Less manual checking on the floor | |
| For team leaders and supervisors | One shared view for many stations |
| Clear data for shift meetings and reviews | |
| Easier comparison of shifts and loss reasons | |
| For quality and maintenance | Full status history |
| Easier review of issues and downtime | |
| More concrete input when finding causes | |
| For the business | More organized production data |
| A good base for OEE rollout | |
| Better continuity of data across connected modules |

Reduce downtime before it starts generating losses!
Get in touch with us and see in practice how explitia.Andon streamlines the handling of production issues and supports quick responses from operators, team leaders, and maintenance.
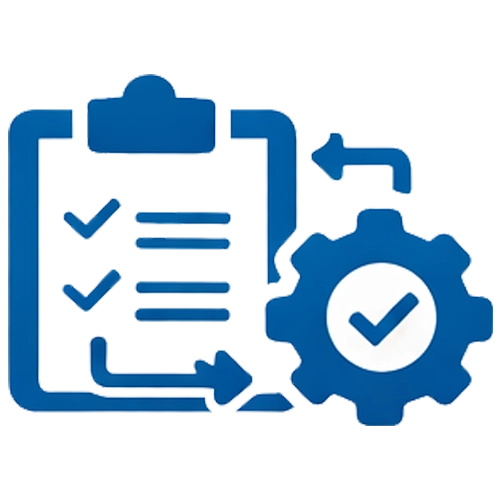
Configuration that fits your plant
In the module, you can configure:
- stations
- statuses
- users
- production shifts
This means you can launch the andon system in line with your floor layout, work organization, and internal naming.
A well-implemented andon system gives you better visibility into station performance and organizes the data needed for daily management.
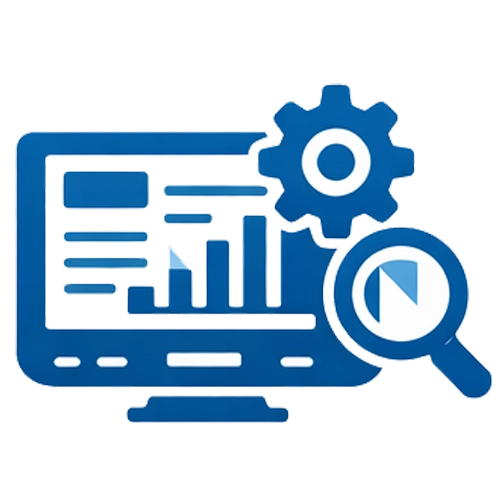
Andon as the first step toward OEE
Andon organizes station statuses, status durations, change history, operators at stations, and OK/NOK counters. That data can then move into OEE, where it supports a broader review of availability and performance.
The sequence is straightforward. First, you build visibility and order. Then you move into loss analysis, metrics, and trends.
How explitia.Andon connects with other Production Portal modules
explitia.Andon can run on its own, but it also fits well into a wider production environment.
OEE
Andon collects statuses, times, and shift data. OEE uses that information for deeper analysis.
More
Statistical Process Control
The combination of Andon and SPC enables ongoing detection of quality deviations and faster response to issues, while also supporting maintenance in reducing sources of disruption.
More
CMMS
The combination of Andon and CMMS supports maintenance by automatically forwarding reports and enabling faster response to failures and machine operation disruptions.
More
Production Portal and other reporting modules
The ability to expand the environment with additional, interoperating modules.
More
Whether you need a broader andon call system, a practical andon light system, or a full andon system as part of a connected production environment, explitia.Andon gives you room to start with what you need and expand later.
Where explitia.Andon fits best?
This solution is a good fit if you:
- want to see current station status in one place
- need a clear board for multiple stations
- want to track the operator at the station
- care about status change history
- want to control OK/NOK counters by shift
- plan to roll out OEE and want to start by organizing the source data
See how an andon system can work in your plant
If you want to organize shop floor visibility, shorten the path to information, and prepare data for further analysis, explitia.Andon is a strong place to start.
We will show you:
- how the andon system works in real production conditions
- what the board looks like for multiple stations
- how the system records statuses, operators, and shift results
- how that data moves into OEE
You can try the core functions of explitia.Andon with no added cost.
Fill out the form and get access to the solution.