


Production Visualization: Three Production Lines in One System. AVEVA Migration in the Food Industry
When several production lines operate in different environments, day-to-day management can become increasingly difficult over time. Different applications, different workflows, limited options for making changes, and the need to work with multiple vendors can make system maintenance noticeably more complicated. A unified production visualization system can help bring these environments together and simplify access to critical production data.
A food manufacturing plant was facing exactly this challenge. The goal of the project was to organize the existing environment, migrate an older version of the AVEVA system, and create a single, consistent production visualizationsolution for three production lines. Another important part of the implementation was web access, allowing users to check the current production status both on the plant floor and from an office computer.
- Industry: food manufacturing
- Goal: standardize the environment and migrate an older version of the AVEVA system
- Scope: three production lines, AVEVA, AVEVA InTouch, production visualization, and web access
- Challenge: different systems across the production lines, limited testing opportunities during ongoing production, and signals that appear only under specific conditions
- Result: one consistent system for monitoring production, access to data from both the plant floor and the office, and the ability to analyze historical data
Three production lines, different systems, and increasingly difficult maintenance
The plant is part of a larger manufacturing group, but the project focused on one specific facility and the three production lines operating there. The customer was already using AVEVA technology, but it was an older version. The environment was no longer supported by the previous system integrator, while its closed architecture made changes and further development difficult.
The other two production lines ran on different software supplied by another vendor. As a result, the technical team had to use several applications and different operating approaches. Even minor modifications required additional service requests, while the fragmented environment made it harder to quickly access production information.
Instead of continuing to develop three independent solutions, the customer wanted to bring the most important data into one place. Our task was therefore to migrate the existing AVEVA system to a newer version and create a shared production visualization layer for all three lines.
We started by understanding the plant and the users’ actual needs
The first step was an on-site visit. We wanted to see the production lines, assess the existing solutions, and compare their actual condition with the project assumptions. Conversations with the technical staff also helped us determine what information users really needed in their day-to-day work and how it should be presented.
One of the key expectations was consistency. Working with different applications had been inconvenient, especially when data related to a single process had to be checked in several places. The customer also wanted production information to be available beyond the operator panels located directly next to the machines.
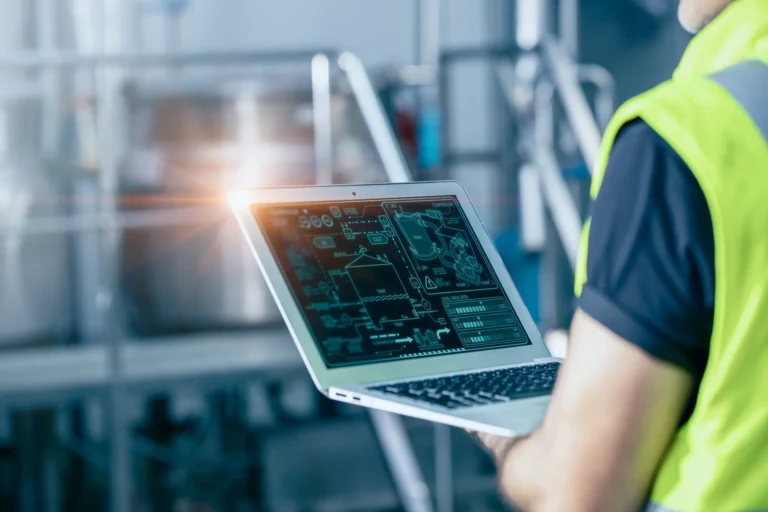
For this reason, a web-based version of AVEVA InTouch became one of the project components. It was the first project in which we implemented a web solution for this customer. Users no longer need to stand next to a specific operator panel to check what is currently happening in production. They can open the production visualization in a web browser and view the most important information from a computer in the office as well.
One production visualization for data from three production lines
Together with the team responsible for the machines, we defined the list of signals that needed to be included in the production visualization. These included information on flow rates, tank levels, equipment status, and other parameters required to monitor the operation of the production lines.
The data came directly from the machines. On our side, we handled the signals, prepared them for visualization, and performed additional calculations where necessary. This allowed the system to display not only raw values but also more useful information, such as machine availability and extended downtime.
At the same time, we migrated the existing AVEVA environment. Ultimately, the two main parts of the project, the upgraded system and the new production visualization, were connected so they could operate together as a single solution.
The system was developed in close cooperation with the customer
We did not want to build the entire application based on a requirements list collected at the beginning of the project and present the completed system only at the end. Instead, we held weekly meetings with the customer throughout the implementation. We presented the current progress, discussed upcoming components, and continuously consulted on how the data should be displayed.
This applied both to technical matters and to the usability of the production visualization itself. Together, we defined the graphical layout, the order in which information would be displayed, and the way individual values should be presented. Two automation engineers on the customer’s side worked closely with us, helping clarify questions related to signals and verifying whether the data displayed by the system reflected the actual situation on the production floor.
Most of the work was carried out remotely, while successive parts of the application were gradually deployed during the project. This gave the customer access to the first production visualization screens relatively early and allowed the team to see the results of the work as the project progressed.
As the system evolved, new views and functions were added to the menu and verified step by step under real production conditions. The on-site presentation of the solution took place later in the project, when a significant portion of the system was already operational and being used by the customer.
Not every signal can be tested on demand
One of the more practical challenges during implementation involved verifying signals that appear only under specific circumstances, such as a particular machine fault. In theory, the simplest solution would be to trigger the appropriate condition intentionally. In an operating manufacturing plant, however, a production line cannot be stopped solely to test a single signal.
In such cases, we tested individual scenarios while the lines were running, using events that occurred naturally during production. Information from the plant team about planned machine downtime was also helpful. This allowed us to verify additional scenarios without artificially triggering conditions that could interfere with production continuity.
This is why documentation alone is not enough when integrating manufacturing systems. A signal list is important, but understanding the actual operating conditions of the facility and adapting the implementation process to the production schedule is just as critical. The same principle applies when designing production visualization for a live manufacturing environment.
Historical data added significant value
One of the features that received particularly positive feedback from the customer was access to historical data through the web version of AVEVA Historian. The solution was integrated with the AVEVA InTouch production visualization, allowing users to check both the current state of production and previously recorded data from within the same environment.
During employee training, there was particular interest in the charts that show how process parameters change over time. Users are therefore no longer limited to the information displayed at a specific moment on a panel next to a machine. They can analyze previous equipment operation, review trends for selected parameters, and use the collected data for further process evaluation.
Integrating AVEVA InTouch with the rest of the system also expanded the possibilities for using production data in reporting. Users are not limited to the information currently visible at the machine. They can return to historical data, analyze equipment performance, and use the collected information for further evaluation of the process.
The current production visualization is intended for monitoring only and does not allow users to control the production process. Whether they are on the plant floor or in the office, however, users can check the current production status and access data collected from individual lines.
Efficient implementation with room for future expansion
The first stage of the implementation proceeded smoothly and without major disruptions. The system was not designed as a closed solution that could no longer be expanded after launch. The customer remains in contact with us and continues to extend the existing production visualization by adding new signals.
In manufacturing plants where production monitoring requirements change over time, this flexibility is particularly important. The ability to develop one consistent system helps avoid a situation in which every new data requirement results in yet another independent application.
In this case, the starting point was three production lines operating in different environments. The result is one place where users can monitor production, analyze historical data, and gradually expand the range of available information. Instead of three separate environments, the plant now has a consistent production visualization that can evolve together with its needs.
An older automation system does not always need to be rebuilt from scratch
Many manufacturing facilities still rely on systems implemented several or even a dozen years ago. Over time, these systems may lose vendor support, become increasingly difficult to develop, or make every modification dependent on a single contractor. However, this does not always mean the entire existing solution must be replaced.
One option is to migrate the system to the latest or another selected stable version while modernizing other parts of the environment. It is also worth determining whether data from different systems can be consolidated into a shared production visualization layer. This makes everyday work easier for operators and automation engineers while giving production managers faster access to the information they need.
A plant audit is a good place to start. It makes it possible to assess the current environment, evaluate migration and integration options, and identify which components are worth retaining. Based on this information, it is easier to select the right solution, estimate the scope of the project, and plan a modernization strategy that reflects the actual needs of the production facility.
Do you want to streamline production systems at your facility?
If individual production lines operate in different applications, an older system is losing support, or production data is scattered across several workstations, the first step should be to assess the capabilities of the existing environment. Migration, integration, and a shared production visualization may prove to be a much better direction than replacing every system from scratch.
We start by understanding the facility, its existing systems, and the actual needs of its users. Based on this assessment, we can determine whether the best approach is an AVEVA migration, integration of several environments, implementation of production visualization, or a combination of these activities within a single project.
Need AVEVA experts? Explore our subcontracting services.


