How to correctly calculate OEE? A practical guide to performance indicators
The OEE indicator is one of the most commonly used measures of production efficiency. You may have come across it in your manufacturing company, but you may not necessarily use it regularly. Well, while the formula itself is simple, the problem is that in many plants the OEE result looks good on paper but doesn’t translate into actual performance. The reason? An incorrect calculation methodology that ignores the realities of the shop floor.
What is OEE and how to calculate it
The OEE (Overall Equipment Effectiveness) indicator is the product of three components:
- Availability – the percentage of time the machine is actually producing compared to the total available production window.
- Performance – how fast you produce compared to the theoretical speed.
- Quality – the percentage of products meeting quality requirements.
Example:
If a machine was available for 90% of the time, operated at 95% performance, and the products had 98% quality, then:
OEE = 0.90 × 0.95 × 0.98 = 0.8379, or 83.8%
It seems simple, and yet… Remember that without context these values are just numbers. Producing 100 pieces during a shift can be a reason for celebration or concern – it all depends on the context.
Production efficiency can be analyzed from two perspectives:
- operational efficiency, which takes into account only the machine’s working time, or
- industrial efficiency, which covers the full cycle, including changeovers, cleaning, setup, and maintenance.
This approach allows you to see whether the problem lies in the machine’s work itself or rather in the organization of the entire process.
Thus, an OEE of 85% on a line producing one type of part is a completely different result than 85% when producing 15 different variants with a changeover every 2 hours.
To fully understand how your production plant actually operates, the condition of your machinery, and where there is potential for improvement, you need to know:
- the real cycle time (not just the theoretical one);
- how many planned changeovers occur during a shift;
- the quality of raw materials supplied to the line;
- the condition of the machine.
By placing data in the right context, the OEE indicator becomes a tool for improving production management and optimizing manufacturing processes, rather than an empty statistic.

Mistakes in calculating OEE
We already know how to calculate OEE. But are we aware of how to avoid the pitfalls related to measuring production efficiency? Omitting context when calculating the OEE indicator is the most serious mistake in assessing production efficiency. If you are thinking about optimizing manufacturing processes, don’t skip the full production cycle. Why? Imagine your machine runs for 7 hours during an 8-hour shift. OEE is 87.5%. Great result? Not necessarily. If you do not account for preparation time, cleaning, or changeovers, you may miss opportunities to optimize production.
Most often, availability is calculated only based on the time the machine is physically producing. We advise against this. You will benefit much more if, when assessing production efficiency, you take into account:
- machine cleaning and sterilization,
- changeovers,
- preparations and setups,
- unplanned and planned downtime.
Such an approach shows the real impact of the production process on the OEE result, not just the machine’s performance detached from the plant’s realities.
If that doesn’t convince you, take a look at how misleading OEE indicators can be when analyzed out of context:
- OEE 80% on a new machine vs. 80% on 15-year-old equipment,
- 85% on the first shift vs. 85% on the third shift (fatigue),
- 90% with premium raw material vs. 90% with class B material.
Omitting context in OEE calculation is the primary error. However, there are other common pitfalls in OEE analysis, including:
- comparing results between lines without considering technological differences (if you compare a line producing simple parts with one making complex components, you are setting yourself up for failure – it’s like comparing a marathon runner to a sprinter),
- calculating OEE only from final data, ignoring micro-stoppages.
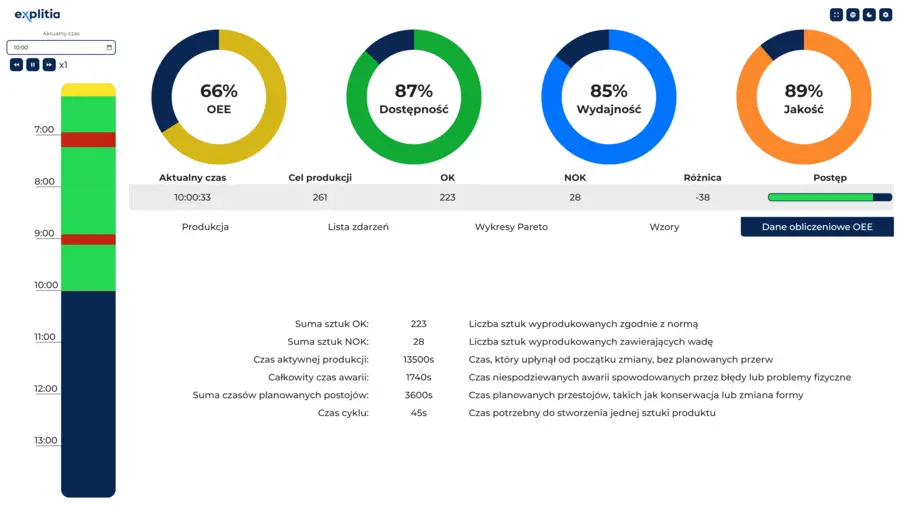
The machine will tell you the truth… What does a production data dashboard look like?
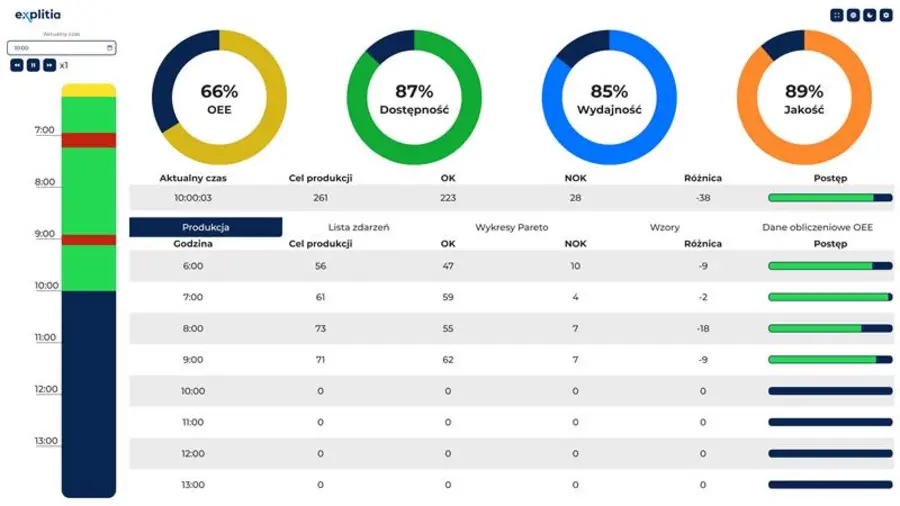
Thanks to modern systems such as the explitia Production Portal, you can read far more from a machine than just the number of pieces produced. On a clear dashboard in real time, you can see, among others:
- current OEE indicators broken down into availability, performance, and quality,
- the number of OK and NOK pieces produced,
- progress against the hourly and daily plan,
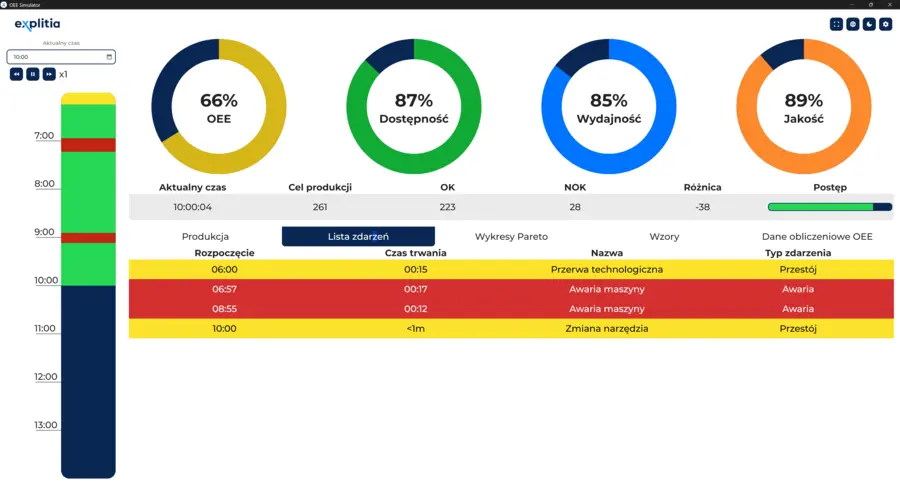
- reasons for downtime with their duration,
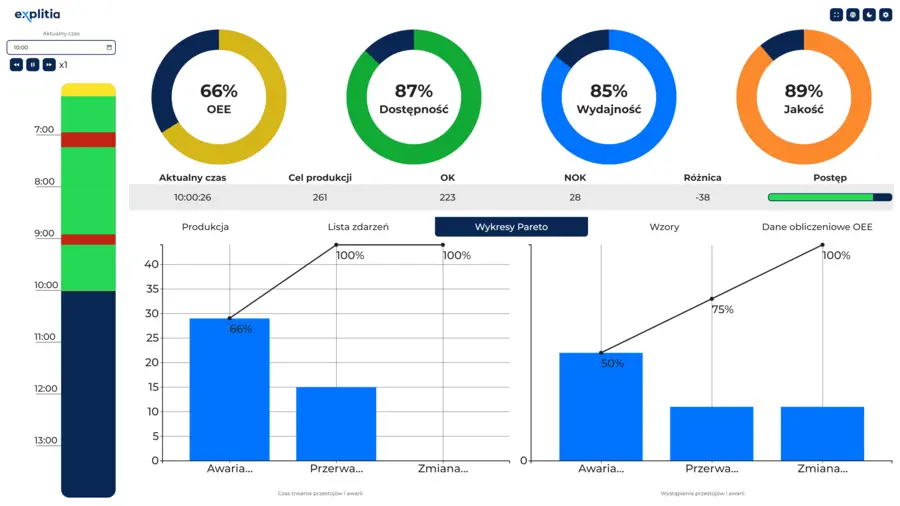
- Pareto charts of the most frequent and longest downtimes,
- hourly production analysis (day by hour).
This means you can not only observe the result but also understand what shapes it.
What’s more, you can filter data by line, shift, operator, or order. This allows for quick problem diagnosis and checking which teams maintain high efficiency.
Applications include:
- comparing efficiency between shifts,
- identifying top operators,
- creating motivational and bonus systems,
- analyzing problems on specific lines.
How to improve OEE? Five practical tips
- Set realistic reference values – if the technological cycle on paper is 30 seconds, but in reality it is 40 seconds, adjust the plan to reality.
- Remember the context.
- Identify the biggest sources of losses – use a Pareto chart to pinpoint bottlenecks.
- Analyze historical data – determine whether the problem is one-time or recurring.
- Use system integration – combining MES, SCADA, and IoT allows you to monitor OEE automatically and respond in real time.
Calculating OEE is not about blindly plugging numbers into a formula. It’s a method for identifying low-efficiency areas in production. Yes, with a good OEE measurement system you don’t have to guess what to optimize – you know for sure.
Read the explitia blog