Statistical process control tools
During the production process, data is recorded and analysed using various types of statistical tools. These tools can be divided into two subgroups: The first – correlation Pareto and Ishikawa diagrams. They help to find the causes of possible errors and problems. Second – control sheet, control cards, histogram, process diagram. Their goal is to help to maintain high-quality processes.
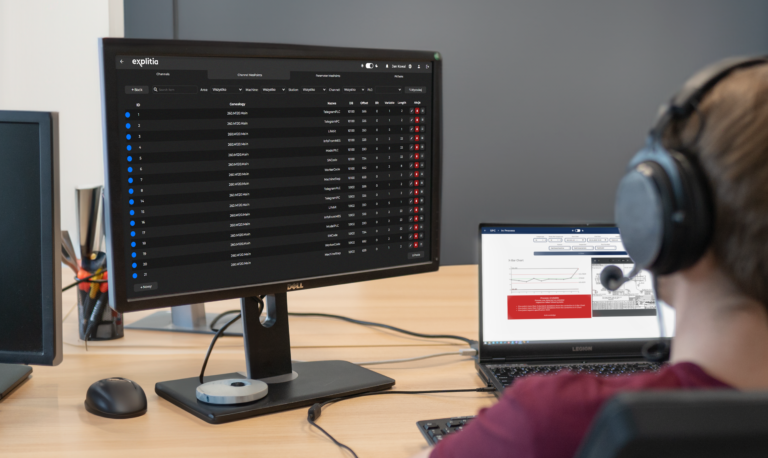
Process monitoring - production quality
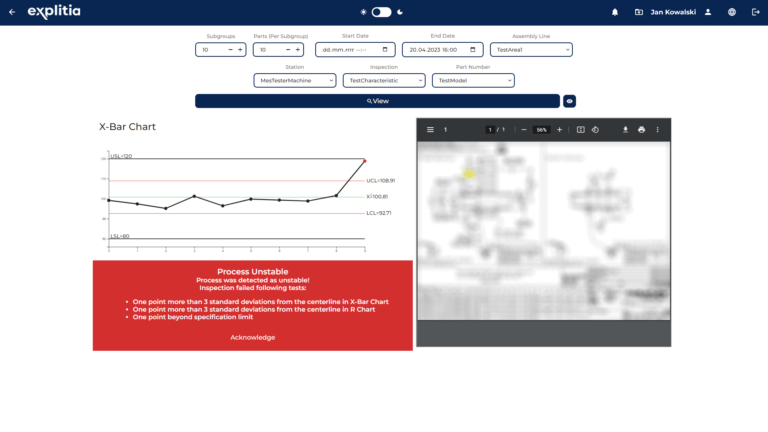
The statistical tools included in the SPC are referred to as K. Ishikawa’s seven golden tools of quality. With their help, it is continuously and automatically checked whether the data obtained from the production process is within the tolerance limits or whether there have been deviations from the assumed standards. Thanks to this, the solution supports the maintenance of repeatability of processes, which eventually affects the quality of production.
Why is it worth it?
| Ability to react quickly | by investigating deviations from standards, the system helps to react before errors or non-conforming products appear. |
| A way to save money | by both optimising production processes and quick identification of the sources of possible errors. |
| Product quality improvement | continuous monitoring of the production process. |
| Access to detailed data | and intuitive reports. |
| Caring for the good image of the company | by offering high-quality products. |
| Making business and investment decisions easier | thanks to reliable data and information. |
| Scalability of the solution | the module can be implemented as a standalone system or in connection with other tools of the Production Portal. |
Contact us
Do you want to move your production plant to level 4.0? Are you interested in modern solutions for industry in the field of automation and digitisation? Be sure to let us know!
