
Data collection and visualisation
We are fully aware that continuously monitoring and analyzing data from machines, devices, and systems in an industrial company can be time-consuming and complex. explitia offers innovative IT solutions that simplify real-time data collection and visualisation, contributing to process optimization, improved energy efficiency, and faster, more informed decision-making.
Data collection and visualization in manufacturing – what’s in it for you?
Here’s what you can measure:
▪️ Energy, water, gas, or steam consumption
▪️ Process parameters such as temperature, pressure, or flow
▪️ Machine condition – e.g. vibrations, operating cycles, or failures
▪️ Quality data – e.g. deviations from specifications
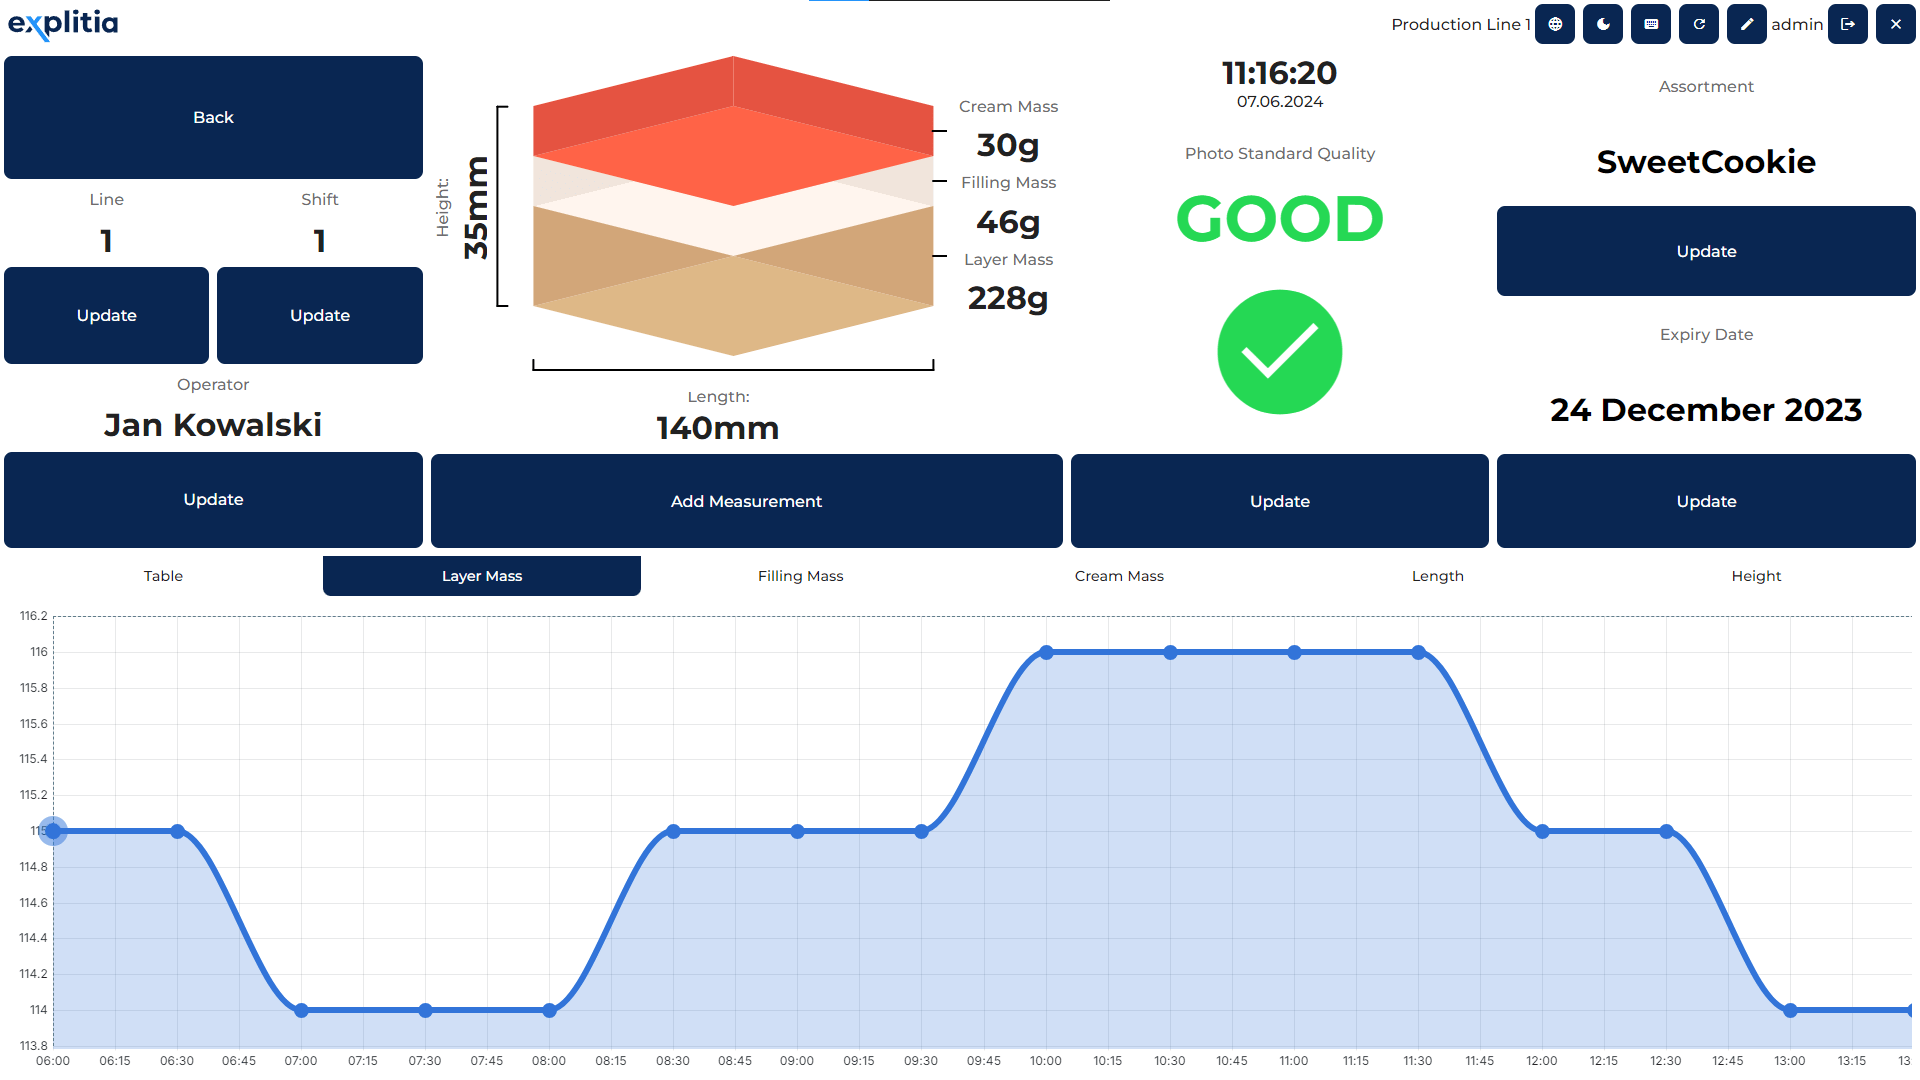
Collected data is presented in a clear, intuitive format – on screens that are easy to understand at a glance.
This means you can detect problems faster, plan production more effectively, and cut unnecessary costs.
Get in Touch
Discover how data collection and visualisation can support your company – not just in utility monitoring, but across the entire production process.

7 benefits of a data collection and visualisation system in manufacturing
Implementing a data collection and visualisation system in a manufacturing plant is an investment that pays off quickly – not only in the area of utilities, but also in monitoring processes, quality, and the technical condition of machines.
Here’s what you can gain:
| Real-time data access | You have constant insight into data from machines, sensors, and measuring devices – with no delays and no need for manual data collection. |
| Faster and smarter decisions | Collecting and visualising production data enables you to quickly spot irregularities and respond before they turn into bigger issues. |
| Better control over utility and resource consumption | The system allows you to monitor energy, water, gas, compressed air, and many other cost-driving parameters. |
| Greater efficiency and process stability | Achieved, among other things, through monitoring temperature, pressure, flow rates, and machine cycles. |
| Reduction of losses and downtime | Real-time data helps you quickly identify sources of losses, unplanned downtime, and resource waste. |
| Automated reporting and data analysis | The system generates reports based on current and historical data, supporting daily management, audits, and cost tracking. |
| Clear visualisation of data from multiple sources | All information is presented in intuitive dashboards – clearly and in one centralized location. |
How do data visualisation systems support production monitoring?
Imagine sitting comfortably at your desk, opening a single application and… seeing a complete overview of your company’s production – clear and at a glance. That’s exactly what our data visualisation system offers.
Designed with efficient production monitoring in mind, it presents key information in a transparent, easy-to-understand format.
Discover the capabilities of explitia’s data collection and visualisation system.

Data acquisition
The system collects data from various sources (machines, sensors, measuring devices, other applications, internal services, external platforms) in real time.

Data archiving
Make informed decisions based on both current and historical information. Analyzing trends and indicators over time opens new possibilities for better planning and forecasting.
Data processing
How much gas did your facility use last month? How much electricity do specific machines in your plant consume? How can you avoid exceeding the dew point temperature? Or maybe you want to track changes in pressure, humidity, line performance, or waste levels in a given process?
Invest in a data collection and visualization system, and these questions will no longer keep you up at night. Reliable real-time data empowers you to make smart decisions – from optimizing energy use and maintaining quality to reducing your carbon footprint.
Key benefits of a data collection and visualisation system
Why is it worth it?
| Licensing based on the number of measurement points | It doesn't matter how many employees use the system or how many devices it's installed on. You pay only for the actual number of data sources. |
| Two-way communication with measuring elements | Visualize values from sensors, machines, and measuring devices — and send setpoints back to them if needed. |
| Faster decision-making | One glance gives you access to up-to-date data. You can also receive automated, readable reports straight to your inbox. |
| Flexible and scalable solution | Easily implemented for a wide range of data types. It can work as a standalone system or be integrated with other tools within the Production Portal. |
| Visualisation from a single machine or the entire plant | An IT solution that serves as a central point of control and insight. |
| Clear and simple interface | All key data visible at a glance — no digging, no confusion. |
| Easy access anytime, anywhere | Use it from your phone, computer, or tablet — in the office, on the shop floor, or remotely. |
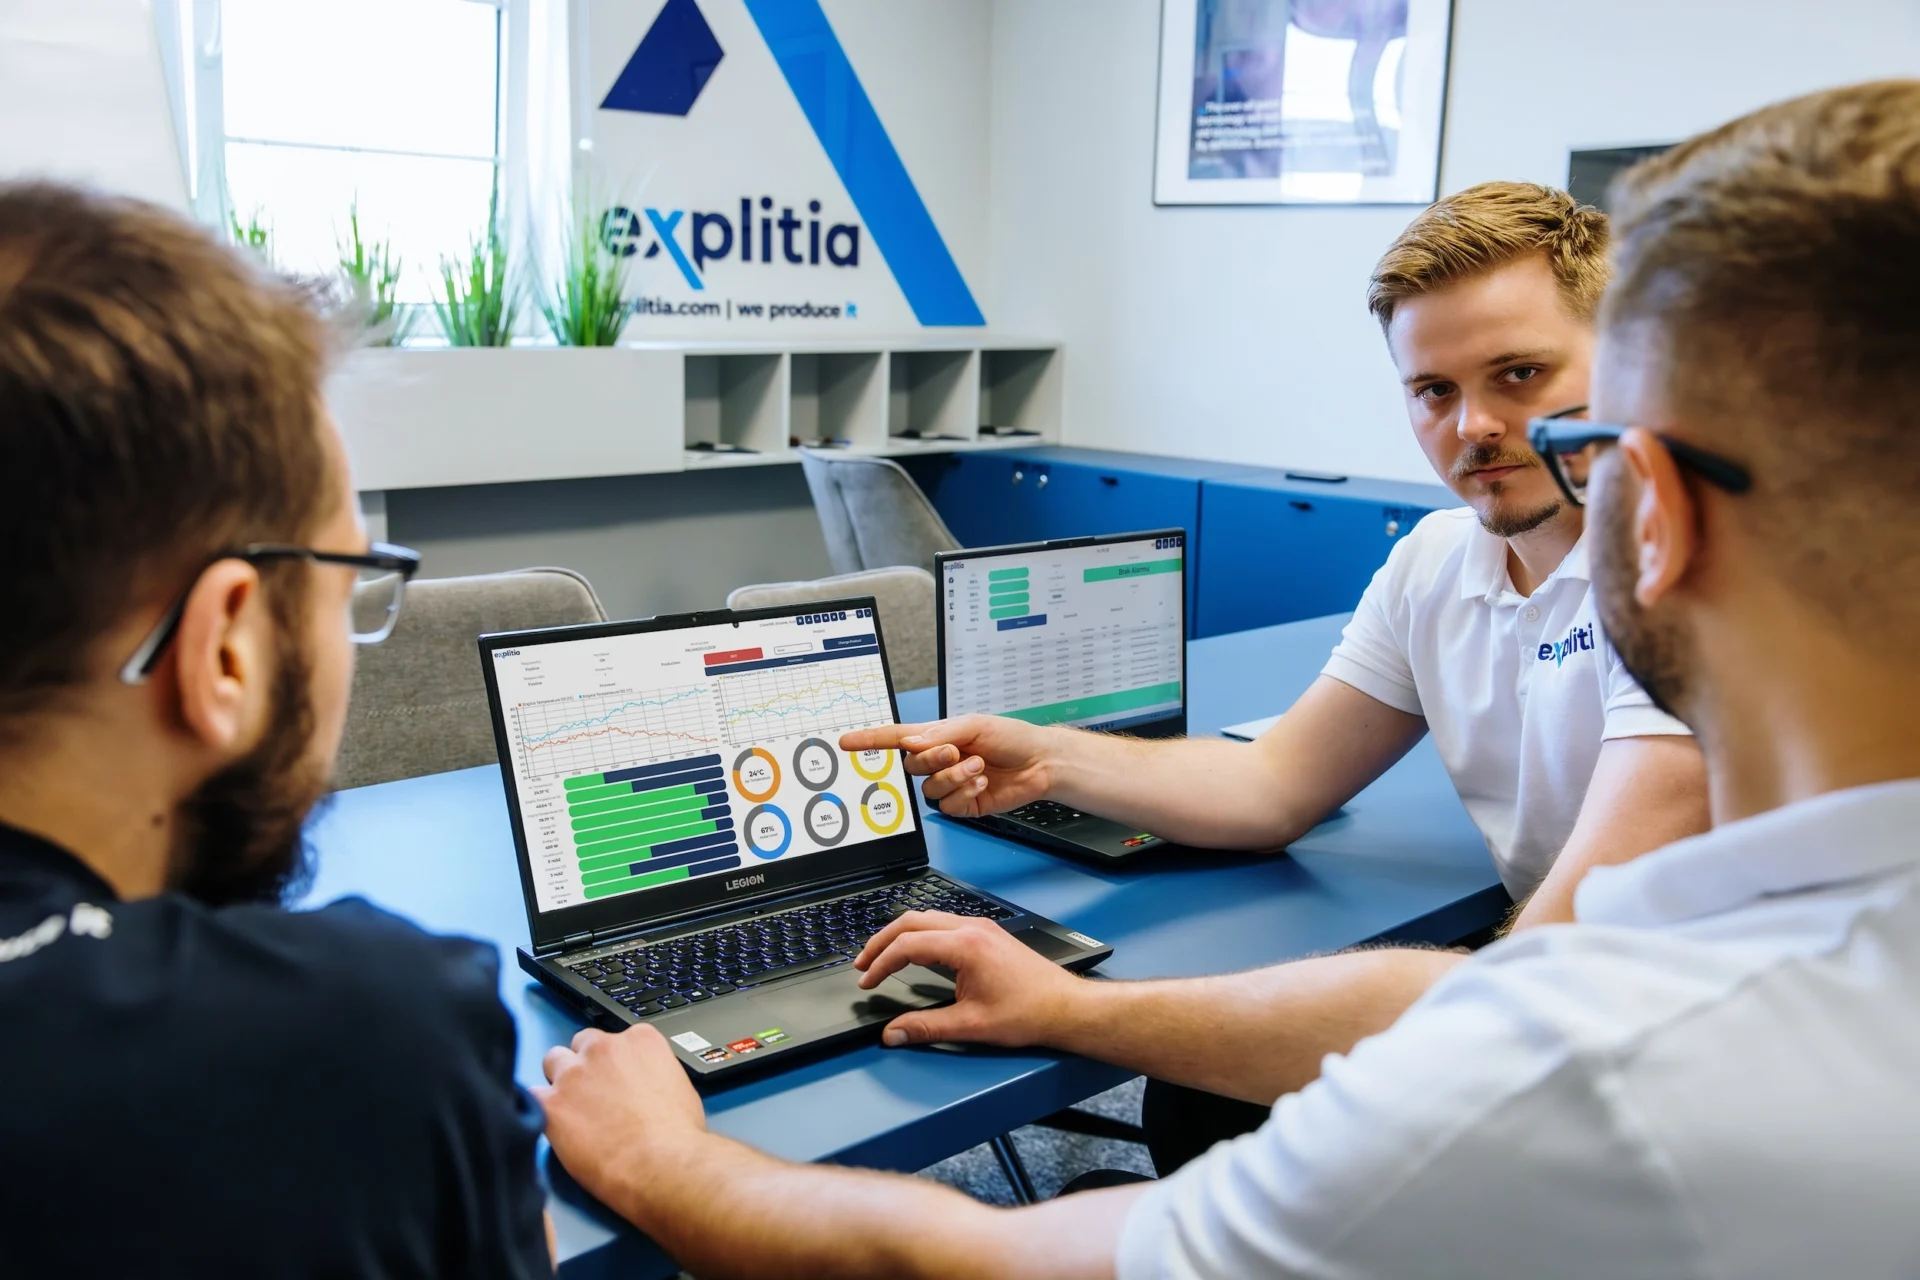
How does explitia support companies in real-time data collection and analysis?
Do you feel like you don’t have enough control over what’s happening on your production floor? Wondering how to monitor your processes more effectively? You’re not alone! explitia provides full support in implementing and utilizing data visualisation systems. You can count on our help at every stage.