


OEE as the foundation of Industry 4.0
In today’s dynamically developing industrial world, where modern technologies are changing the traditional approach to manufacturing, there are more and more tools optimizing production processes. One of the key indicators, in the context of Industry 4.0, is OEE (Overall Equipment Effectiveness). It allows for a detailed analysis of machines and devices in terms of three main elements. Do you know the benefits of OEE? Do you have everything you need to implement it? You will find a complete set of information in the article below!
OEE — what is it and why is it worth measuring?
It is a metric that measures the overall effectiveness of equipment and shows how well a machine, production line or production cell uses its available production time to manufacture good-quality products at the expected speed. In practice, OEE helps answer three key questions: was the machine available when it was supposed to run, did it operate at the expected performance level, and did the manufactured products meet quality requirements?
OEE is a composite indicator based on three key areas: availability, performance and quality. Each of them reflects a different type of production loss, which is why the final percentage result should not be analyzed in isolation. Only by checking which OEE component has the greatest impact on the final result can a company identify the real source of inefficiency in the production process.
- Availability refers to the time when the machine is ready to work compared to the planned production time. It includes planned downtimes, e.g., breaks or machine setups, and unplanned downtimes such as failures. It is an indicator that often undergoes adjustments depending on the individual needs of the machine park.

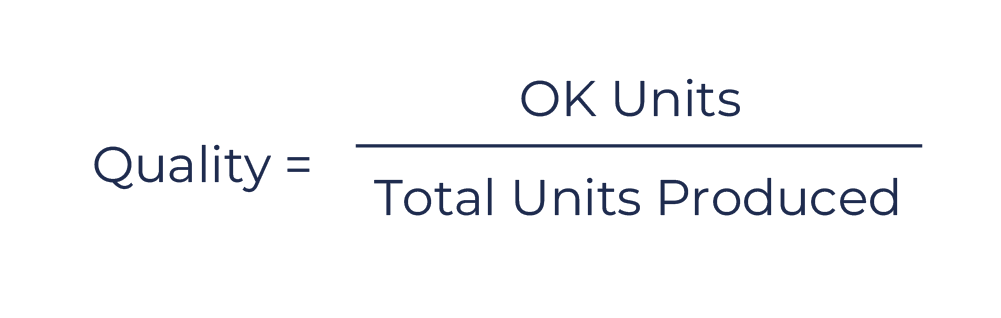
- Performance measures how quickly a machine produces goods in relation to its theoretical maximum efficiency. It includes various factors, including short-term downtimes and process slowdowns. It denotes the number of units produced, relative to the set goal.
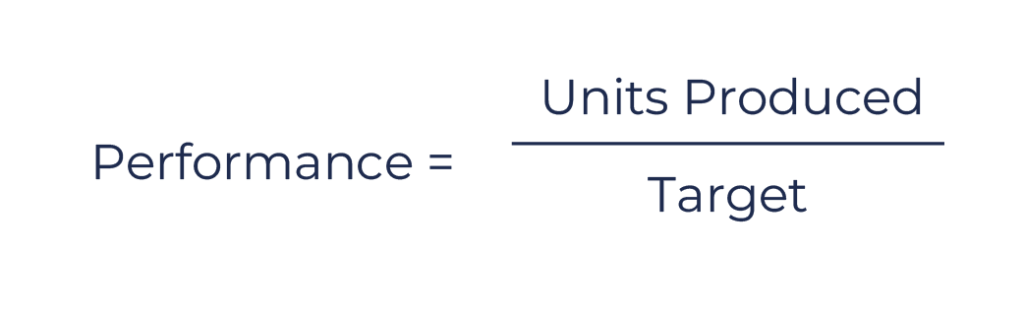
- Quality focuses on the proportion of products that meet quality requirements to the overall number of produced units. It is usually the ratio of defect-free products (OK units) to the total number of produced units (OK + Not OK units).

The OEE metrics itself is simply a multiplication of the above parameters, and is always calculated in the same way:

OEE formulas — how to calculate availability, performance and quality?
To calculate OEE correctly, it is not enough to know only the final formula. In practice, you first need to calculate the three components of the indicator: availability, performance and quality. That is why the phrase “OEE formulas”refers not only to the main OEE formula, but also to the supporting formulas that help identify where the biggest production losses occur.
The basic OEE formula is:
OEE = Availability × Performance × Quality
The individual components can be calculated as follows:
Availability = actual operating time / planned production time
Availability shows what portion of the planned production time the machine was actually running. It is reduced mainly by breakdowns, unplanned downtime, waiting for materials, lack of operators, adjustments and other stoppages that limit production time.
Performance = actual number of produced units / theoretical number of units that could have been produced
Performance shows whether the machine was producing at the expected speed. This component is affected by micro-stoppages, slowdowns, operation below the nominal cycle time and unstable process parameters.
Quality = number of good units / total number of produced units
Quality defines the share of products that meet quality requirements in total production output. This indicator is reduced by NOK units, defects, rework, rejects and losses generated during start-up or changeover.
It is important to remember that even if one parameter looks good, a poor result in another component can significantly reduce the overall OEE. That is why OEE analysis should always include both the final percentage value and a separate assessment of availability, performance and quality.

See how to measure effectiveness for your production.
If you want to discuss how to implement the equipment effectiveness metric in your production, contact our experts and they will help you make the next step.
How to calculate it step by step?
The best starting point is to collect data from one machine, production line or production cell. To calculate OEE, you need data on planned production time, actual machine operating time, number of produced units, number of good units and ideal cycle time.
Example:
A plant plans an 8-hour production shift, which equals 480 minutes. After subtracting the planned break, the planned production time is 450 minutes. During the shift, the machine had 60 minutes of unplanned downtime, so the actual operating time was 390 minutes.
Availability = 390 / 450 = 86.7%
If the ideal cycle time allows the machine to produce 2,340 units in 390 minutes, and the actual output was 2,100 units, then:
Performance = 2,100 / 2,340 = 89.7%
If 2,030 out of 2,100 produced units met quality requirements, and 70 were classified as NOK, then:
Quality = 2,030 / 2,100 = 96.7%
The final OEE is:
OEE = 86.7% × 89.7% × 96.7% = 75.2%This means that the machine used approximately 75% of its production potential. The remaining part represents losses caused by downtime, operation below nominal speed or quality issues. This result should not be treated only as a number in a report. Its greatest value lies in showing which area of the process should be improved first.
How to interpret the the result?
The OEE result alone does not tell the full story about the condition of the production process. Two machines may have a similar OEE result but completely different sources of loss. In one case, the main problem may be breakdowns and downtime. In another, it may be reduced operating speed. In a third, the issue may be a high number of quality defects.
That is why the OEE result should always be analyzed together with its components. If availability is the weakest area, improvement activities should focus on reducing downtime, improving maintenance, analyzing failures and shortening changeover times. If performance is the main problem, it is worth looking at micro-stoppages, actual cycle time, speed losses and operator work organization. If quality has the lowest score, the company should analyze defect causes, process stability, technological parameters and quality control.
This approach turns OEE from a reporting metric into a practical tool for production optimization.
Benefits of Implementing OEE
The main benefit of implementing OEE is the ability to observe the real efficiency of machines and adequately manage the machine park. Thanks to the installed web application, it is possible to observe and analyze the state of the plant in terms of OEE metrics and the condition of the machine from the office. This allows us to see the level of OEE achieved by individual devices. Depending on this, we can determine whether the existing machine base is sufficient to achieve the planned production, or whether it is necessary to purchase new devices. Moreover, monitoring OEE allows for the identification and elimination of downtimes and failures, which directly translates into cost reduction and increased production efficiency.
The greatest benefit of implementing OEE is the transition from intuitive production management to decisions based on real data. Production managers no longer need to rely only on shift reports or subjective observations. They can see which machines stop most often, which lines operate below expected performance and where the biggest quality losses occur.
OEE implementation also makes it easier to identify bottlenecks. If one machine regularly reduces the efficiency of the entire production line, OEE data helps determine whether the problem is caused by breakdowns, long changeovers, limited operating speed or quality issues.
Another important benefit is improved communication between production, maintenance, quality and management teams. All departments work with the same data, which makes it easier to set priorities, plan maintenance activities, analyze recurring problems and evaluate the effectiveness of implemented improvements.
Common mistakes when calculating the metric
- Unclear data definitions — for example planned time, downtime, OK/NOK units or ideal cycle time.
- Ignoring micro-stoppages — short stops are often not reported, even though they can generate significant losses.
- Incorrect ideal cycle time — an unrealistic reference value can distort the OEE result.
- Using OEE to evaluate operators — OEE should support process analysis, not employee control.
- No regular analysis of results — measuring OEE alone does not improve production unless the data leads to action.
Requirements for Implementing OEE
The implementation of this indicator is the first step in introducing the concept of Industry 4.0. It is a relatively easy element of digitizing the production facility, which allows for the gradual introduction of further changes. However, to achieve this, several elements are necessary.
- A PLC (Programmable Logic Controller), which collects data from the machine about the number of units produced with OK status (good units produced), with NOK status (defective units), and the status of the machine, i.e., whether it is working automatically, has a break, or maybe a failure.
- Network infrastructure and a server, on which a dedicated application for the analysis and visualization of OEE data can be run. Such an application can be accessible both on large screens in the production hall and on computers, allowing easy access to data and their analysis from the office. In the absence of a server, the system can be run locally, on a computer by the machine.
In addition to technical infrastructure, organizational preparation is also very important. Before implementing an OEE system, the plant should define a standard for downtime classification, production time calculation, report structure and responsibility for data analysis. Without this, even the best IT system will only collect data that is difficult to translate into specific improvement actions.
In practice, it is worth starting with a pilot implementation on one machine or one production line. This makes it possible to verify data accuracy, refine the downtime reason dictionary, test dashboards and prepare the team to work with the new indicator. Only after the measurement process has been stabilized should OEE be extended to other production areas.
It is also important to connect OEE data with other systems used in the plant. Integration with a MES system enables efficiency analysis in the context of production orders. Integration with ERP makes it possible to link production data with planning and order execution. Integration with CMMS helps maintenance teams analyze failures, downtime and machine service history.
OEE as the first step towards Industry 4.0
The implementation of OEE opens the way to further innovations within Industry 4.0, such as traceability systems, which allow for even more precise management of production and product quality. Thanks to the infrastructure implemented for monitoring OEE, it is easy to extend the functionality to additional modules such as barcode scanners, which enable tracking of specific product batches.
OEE is often one of the first areas of production digitalization because it requires collecting basic machine data: operating status, number of produced units, downtime, cycle time and quality information. The same data can later feed other digital solutions, such as MES, SCADA, traceability, SPC, Andon, production reporting or predictive maintenance systems.
For this reason, OEE implementation should not be treated as a single reporting project. It is part of a broader production management ecosystem in which shop floor data is available in real time and can be used by operators, shift leaders, process engineers, quality teams, maintenance departments and management.
FAQ – Overall Equipment Effectiveness indicator
What is it?
OEE is a metric that measures the overall effectiveness of equipment. It shows how efficiently a machine, production line or production cell uses its available working time. It includes three components: availability, performance and quality.
What are the basic formulas?
The basic formula is: OEE = Availability × Performance × Quality. Availability is calculated as the ratio of actual operating time to planned production time. Performance shows the relation between actual production and theoretical production capacity. Quality defines the share of good units in the total number of produced units.
How to calculate this indicator?
To calculate OEE, you first need to calculate availability, performance and quality, and then multiply these three values. The required data includes production time, downtime, number of produced units, number of good units and ideal cycle time.
What reduces the indicator the most?
OEE is most often reduced by breakdowns, unplanned downtime, changeovers, micro-stoppages, operation below nominal speed, quality defects and start-up losses.
Can OEE be calculated manually?
Yes, OEE can be calculated manually, for example in a spreadsheet. In practice, however, manual reporting is vulnerable to errors, delays and omitted short stoppages. That is why manufacturing plants increasingly use automatic machine data collection.
Is OEE only suitable for large manufacturing plants?
No. OEE can be used both in large factories and smaller production plants. The key is to adapt the measurement method to the scale of production, machine type and available technical infrastructure.
Let's talk about the effectiveness in your production.