Data analysis in industry — Discover the 2-minute rule in explitia
Data analysis in the industry can be like looking for a needle in a haystack. However, this is not always the rule. David Allan’s two-minute rule comes to the rescue, serving as an efficient time management method. This technique is part of the methodology described in the book “Getting Things Done” and is characterized by its simplicity, enabling quick practical application. We utilize this principle in all explitia solutions. Our products allow for efficient data analysis from the entire production facility. How is this possible? More on that in the article.
- Data vizualization – less is more
- Data transfer related to media
- Efficient data analysis through alerts
- Data analysis in industry from various production areas
- Modern standards in the design of SCADA system
- Process control – SPC independence
- Andony OEE
- Production Portal – quality data analysis
- Order management
Data visualization – less is more
Experience gathered in manufacturing plants has shown that the systems provided are often underused by employees. This is usually due to the overload of these solutions and too much data requiring detailed analysis. Often, this stems from a lack of the customer’s experience in digitization, who desires the system to deliver as much information as possible. Excessive data accumulation in systems prolongs the implementation and training time, making tools difficult to use (whereas they should be flexible). At the same time, it is time-consuming to both set up and configure charts and analyze them. This makes it so that in practice employees do not use them to their full potential.
Aware that the list of tasks for a technologist or operator can be very long and engaging, at explitia, we design systems in which access to information is easy and clear. The goal of this – in the name of David Allen’s principle – is to make system analysis as simple as possible, which should be done during work, without distracting the employee from their duties for more than 2 minutes.
With experience in industrial digitization, we conduct an assessment with the client. This allows us to identify the most important parameters, indicators, and modules that will realistically be used by employees. As a result, the created system is transparent and intuitive, which influences the speed of learning. Meanwhile, the end user needs just two minutes to analyze the key information for them.
Data transfer related to media
In the solution for collecting and analyzing data, a reasoning mechanism is used by:
- simplifying information;
- flattening details to a simple indicator of “yes”, “no” or a percentage.
This allows for avoiding trends for many different measurements and parameters. In the system, the information is processed, recalculated, and displayed to the user as a final value.
Such data is often translated from technological to more business-friendly language, understandable not only to specialists, e.g., energy consumption can be immediately converted into cost in euros. Thus, the system acts as an intermediary between the production and the business layers. Not only does the quality of data improve, but also their transfer.
Example: In many manufacturing plants, the most commonly used and simultaneously the most expensive medium is compressed air. Therefore, its measurements will be displayed on the main visualization panel instead of a series of very technical parameters. The reasoning principle should also be utilized, for example, when calculating CO2 emissions. This is particularly important in the context of ESG policy.
Efficient data analysis through alerts
Solutions offered by explitia are designed to deliver alerts and notifications (e.g., via email) in a clear graphical manner, using distinctive colors. Interestingly, in this model, even turning on the device is not required – reading the automatically sent message, which informs about a specific situation, is enough.
Example: A user may receive a notification about disproportionate gas consumption relative to production.
Quick access to important information positively affects:
- reaction time;
- safety;
- maintenance of production continuity;
- better use of media, e.g., electricity;
- quality of manufactured products.
Data analysis in industry from various production areas
Parameters collected by IT systems always come from different technological layers, e.g., automation and electrical. They are generated by various sensors requiring different mounting methods – such as compressed air sensors mounted in pipes.
Additionally, data is collected from various places, including APIs or SQL databases. To enable their effective analysis, it is necessary to unify information to a uniform standard, adjusted to client requirements. This may include aggregating data on:
- an OPC server and making it available through protocols to higher-level management systems;
- collecting all information in a single, relational SQL database.
Modern standards in the design of SCADA system
When building SCADA (Supervisory Control And Data Acquisition) solutions, it is worth paying attention to current trends. One of them is Situational Awareness. In the past, this system was designed in a way that was not clear, with many different pieces of information and graphics. Data were hidden in different windows, and navigation was very unintuitive, complicating efficient analysis.
Currently, SCADA solutions use soft shades of gray and a unified, simple layout. Information about failures or alarms, on the other hand, is displayed in bright colors. This ensures that employees do not overlook them and can quickly respond. SCADA and MES (Manufacturing Execution System) systems support not only monitoring of active and reactive energy consumption but also allow for receiving alerts, e.g., in the case of air conditioning being on while doors are open. Such solutions are applicable not only in manufacturing plants but also in hotels or offices. Which alarms should be displayed as a priority are determined during the pre-implementation audit, preventing the unnecessary accumulation of irrelevant data.
Example of an explitia client
A manufacturing plant covering almost a hectare. Throughout this vast area, electrical cabinets with electric meters are placed, each collecting about four hundred different parameters. It’s easy to imagine that with several dozen such meters scattered over a large area, these parameters were never analyzed because it is simply unnecessary.
The explitia company designed an IT system that consolidated all data to an OPC server. It ensured their visualization, and most importantly, detailed analysis of necessary parameters. As a result, it became possible to infer about consumption, not relying on the electricity bill alone.
Process control – SPC independence
In many manufacturing plants, the technologist must independently compare and check all data collected in the form of trends to see if they deviate from the norm. To be feasible, they must primarily learn this process. The whole thing is therefore tedious, time-consuming, and can generate errors. The SPC system learns itself. Thanks to this, the employee – to analyze data and predict possible failures – does not need specialized knowledge and experience. The system automatically analyzes processes. Operating the SPC solution, however, is intuitive and can be as simple as reading an email alert about an approaching limit level or exceeding indicators.
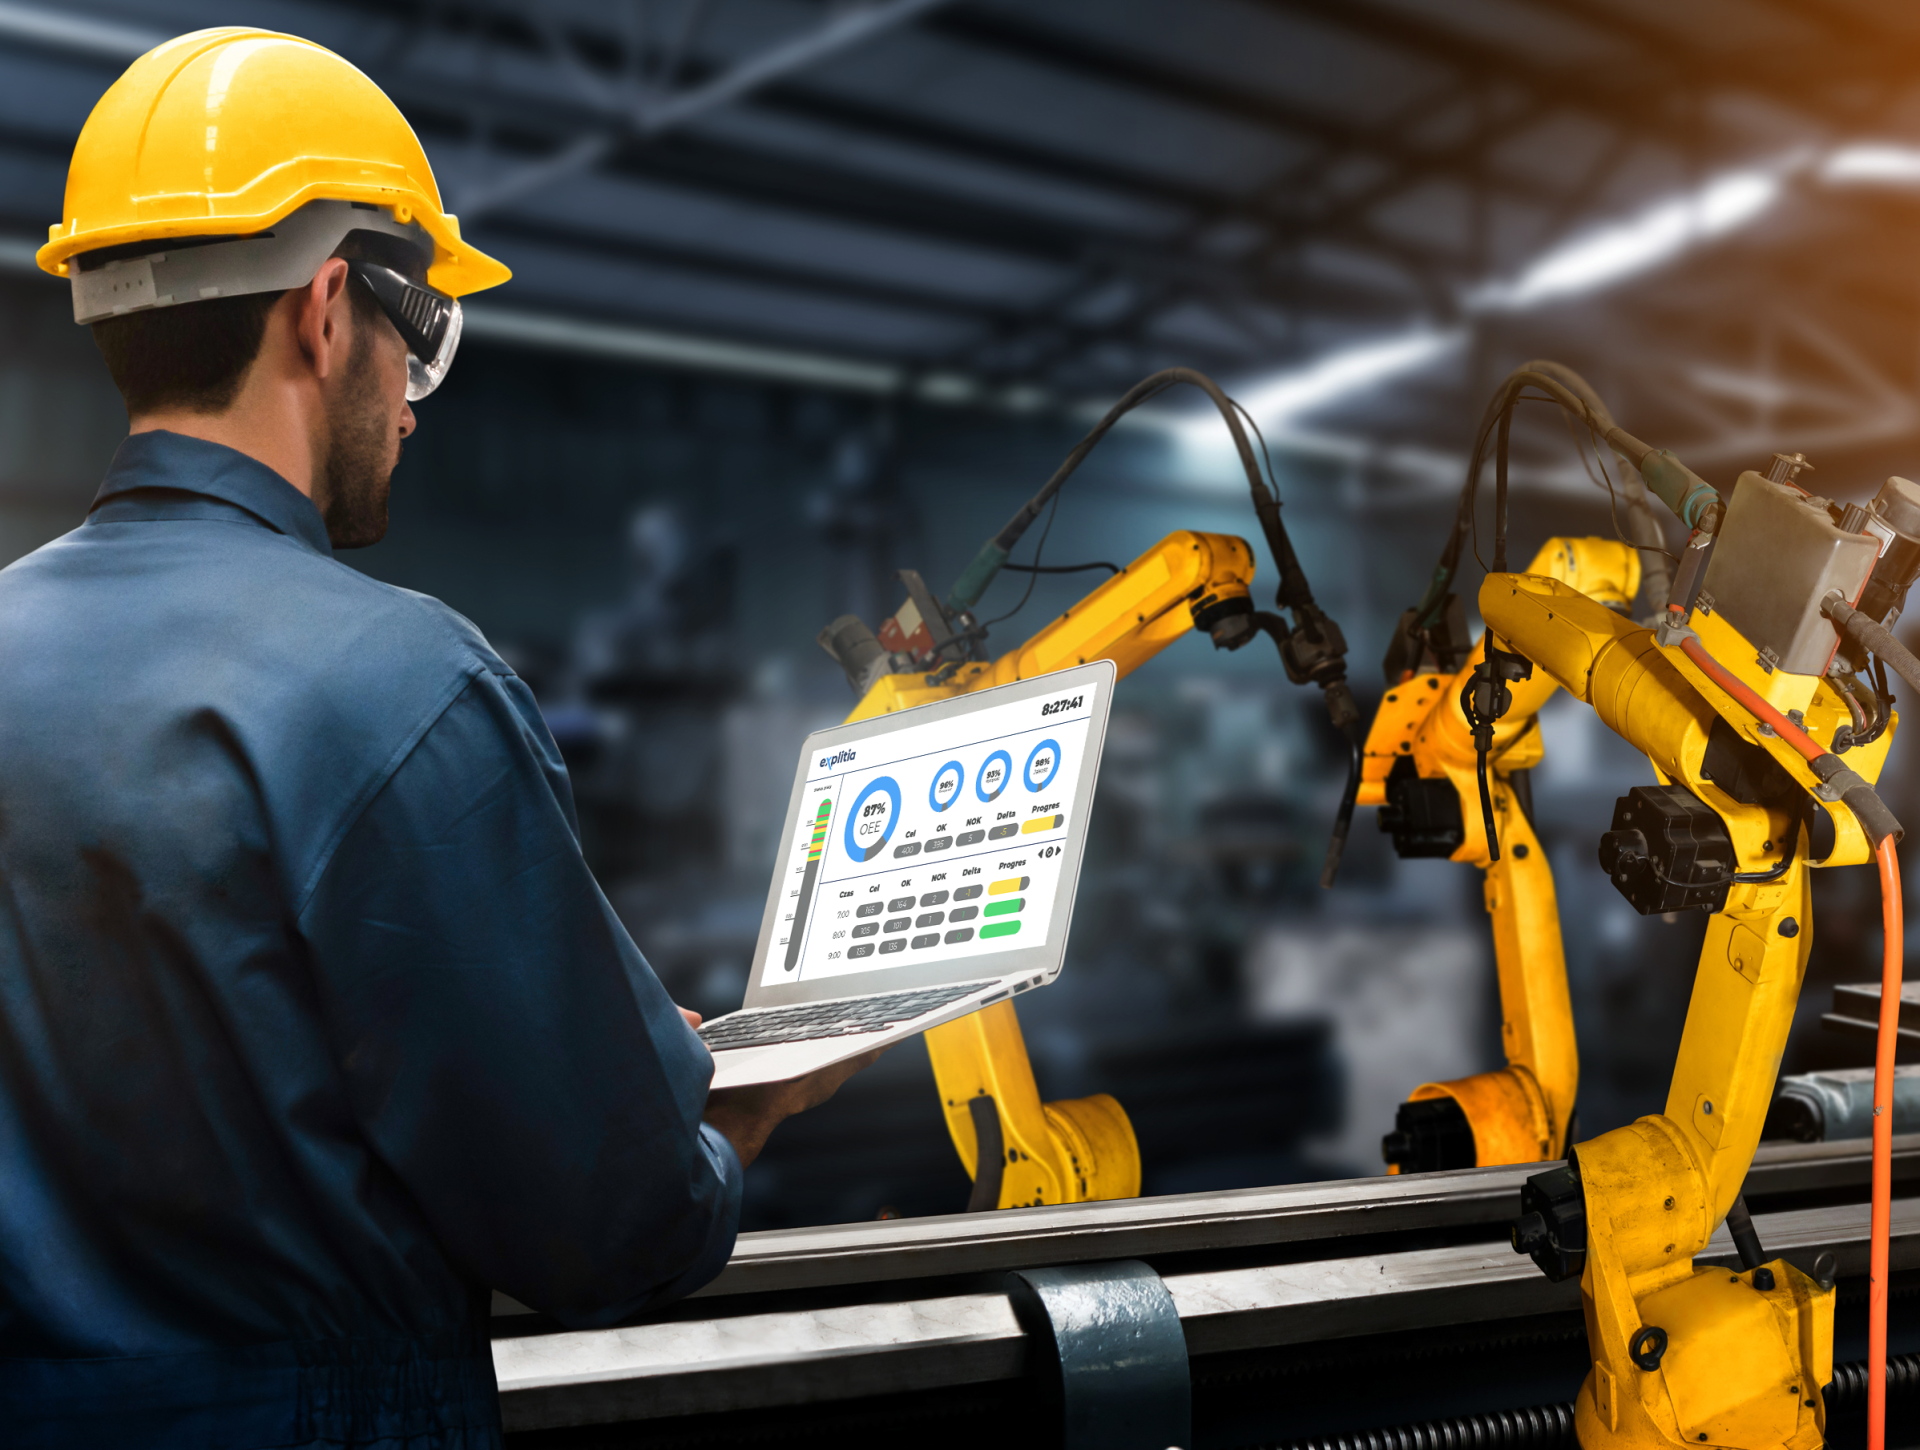
Andon OEE
OEE significantly simplifies the assessment of availability, quality, and performance of production processes. It presents key indicators in an easy and understandable way, using percentage data and colors. The OEE indicator visualization can be located on:
- a computer in the management office, allowing constant monitoring of information;
- a large display in the production hall;
- an HMI interface for operators, ensuring easy access to efficiency data directly on the panel, which they always have at hand.
Regardless of the location, each method of visualization allows for data analysis, possible to be carried out in just two minutes.
Production Portal – quality data analysis
The Production Portal provides a quick, two-minute analysis of production quality, automating the verification process of units at every production stage. Instead of manually checking each production unit on paper, the system automatically checks: whether the product meets the required parameters, whether the operator is carrying out the right order, and whether the machine is correctly configured for the type of device. The Production Portal also delivers reports that highlight deviations from standards, facilitating the identification of problems without the need to continuously monitor trends or parameters on the machine.
Example: Demonstrating the incorrect torque of a screw securing a car seat.
Order management
The two-minute rule also finds application in the management of production orders, thanks to a simple and intuitive interface that facilitates operators’ management of orders. The system is integrated with other modules and optimized for maximum simplicity. The worker’s action focuses on starting and completing an order, while other operations happen automatically.
Implementing the 2-minute rule in production management and data analysis is a key element in the efficient use of time and resources. Thanks to advanced solutions, it is possible to quickly and effectively manage data, translating into increased productivity and reduced operational costs. This simple yet revolutionary principle can significantly contribute to improving efficiency in every manufacturing plant.
Are you digitizing your manufacturing facility? Would you like to talk about IT solutions for industry? Contact us.
Contact us
Do you want to move your production plant to level 4.0? Are you interested in modern solutions for industry in the field of automation and digitisation? Be sure to let us know!