
OEE Monitoring Shows 85% – Success or Illusion? A Complete Guide
- Can we increase production capacity without further investment?
- Are our machines truly operating at the right level of efficiency?
- What is the actual amount of scrap being generated?
- Can we bring down the number of products failing to meet quality standards?
Questions like these arise every day on the factory floor, and answering them calls for accurate, dependable data. One of the most widely used measures of manufacturing efficiency is OEE – Overall Equipment Effectiveness.
OEE offers a clear picture of how well plant and machinery are being utilised. It makes it easier to spot issues such as downtime, reduced performance, or high defect rates, and to decide where improvements will deliver the greatest benefit.
But having an OEE figure in itself is not enough. What really matters is that the data behind it is reliable, consistent, and up to date.
So, what does a reliable OEE actually look like? How should it be calculated correctly, and how often should it be reviewed in practice? Can manual systems ever guarantee accuracy, or is it better to rely on automation?
In this guide, we’ll explore these questions, break down the components of OEE, highlight the risks of inaccurate calculations, and show how automation and modern solutions – such as the Production Portal – can strengthen both efficiency and control across your operations.
What is OEE Monitoring? Definition
OEE, or Overall Equipment Effectiveness, is a metric used to measure how effectively machines and equipment are utilised in production processes. At first glance, it may look like a simple percentage showing how well a given machine is performing. In reality, however, it is a management tool rooted in the philosophy of Lean Manufacturing. Its role goes beyond assessing equipment performance – it highlights where losses occur and where improvements are needed.
OEE brings together three key dimensions of production: availability, performance, and quality. This combination provides a complete picture of efficiency – from machine uptime, to actual cycle speed, to the proportion of products that meet quality standards. Unlike isolated metrics (such as breakdown rates or scrap percentage), OEE delivers a holistic view, enabling manufacturers to identify losses throughout the entire production cycle – from changeovers to challenges with raw materials, components, or equipment condition.
In practice, OEE is one of the most valuable tools for Lean specialists. It allows them to measure the so-called Six Big Losses of manufacturing – including breakdowns, downtime, minor stoppages, and defective production. Used consistently, OEE becomes a powerful driver of continuous improvement. It supports decision-making based on accurate data rather than guesswork or error-prone manual entries. With it, plant managers and operators can pinpoint exactly where to improve, optimise schedules, reduce downtime, and safeguard product quality.
It’s important, though, to always interpret OEE in the context of the entire production process. The number on its own can be misleading; only by considering the full production cycle, the frequency of changeovers, the quality of raw materials, and the condition of machinery can you gain a true picture. For this reason, OEE should not be seen as just another statistic, but as a comprehensive Lean tool for monitoring and improving manufacturing processes.
OEE Monitoring – Components
The OEE indicator is built on three factors: Availability, Performance, and Quality. Each measures a different aspect of how machines operate, and only when multiplied together do they provide a complete picture of efficiency.
OEE = Availability × Performance × Quality
- Availability
Availability shows how much of the planned production time is actually used. It accounts for downtime caused by breakdowns, changeovers, or a lack of materials. - Performance
Performance measures how fast the equipment runs compared to its ideal cycle speed. It is calculated as the ratio of the actual output (adjusted for availability) to the theoretical maximum output at full speed during that time. This means that even when a machine runs without stoppages, performance losses can still occur due to minor stoppages, slower cycle times, or operational issues. - Quality
Quality reflects the proportion of good products – those meeting the required standard – within the total number of units produced.
Example
Let’s imagine a factory scenario:
- Planned production time: 480 minutes (8 hours)
- Downtime: 60 minutes (changeovers, lack of materials), leaving 420 minutes of operating time
- Ideal cycle time: 1 minute per unit
- Actual output during operating time: 380 units
- Defective units: 20
Calculations:
- Availability = 420 ÷ 480 = 87.5%
- Performance = (1 × 380) ÷ 420 = 90.5%
- Quality = 360 ÷ 380 = 94.7%
- OEE = 0.875 × 0.905 × 0.947 = 74.9%
This result shows that the plant’s real efficiency is just under 75% – meaning that one in every four potential production minutes was lost due to downtime, reduced speed, or quality issues.
Context Matters in OEE Monitoring
OEE should always be interpreted in the context of production conditions. Short production runs and frequent changeovers can reduce availability, even when machines themselves are performing well. Production that requires high precision or difficult raw materials is more likely to impact quality. Meanwhile, processes made up of many short cycles may reduce performance, even if operators do not notice significant stoppages. For this reason, the same OEE value – say 70% – may represent significant room for improvement in one factory, while in another it could already be considered a satisfactory result.
How to calculate OEE
The calculation methods for OEE are described in detail in Section 3 — here we’ll focus on the practical side: how often the metric should be calculated and for what purpose. It is the frequency of measurement that determines whether OEE becomes a genuine management tool or just a number in a spreadsheet.
How Often Should OEE Be Measured?
Shift Level – Analysing OEE over the course of a single shift allows operators and team leaders to react immediately. If OEE starts to drop below the expected level, the cause – such as changeovers, operating parameters, or tool condition – can be investigated straight away. Waiting until the end of the shift to review the data means that losses have already occurred.
Daily Level – A daily report provides a fuller picture of production performance. It allows for comparison between different shifts, helps identify recurring issues, and supports short-term resource planning. Production managers can use it to see where the biggest differences in work organisation occur.
Weekly and Monthly Level – At this level, OEE becomes a strategic tool. It enables the tracking of trends, evaluation of the effectiveness of improvement initiatives (for example, shorter changeovers, tool replacement, or operator training), and reporting to management or investors. These reports often form the basis for benchmarking and long-term investment planning.
Real-Time Monitoring – The most advanced, and arguably the most valuable, level of monitoring. OEE data is updated continuously, so operators can see immediately if availability drops, team leaders are alerted to performance issues, and the quality department can spot increases in rejects while production is still underway. The key advantage is the ability to act in the moment, rather than after the fact. This approach helps eliminate losses caused by minor stoppages and small disruptions – one of the main sources of waste identified in Lean methodology as the Six Big Losses.
OEE – A Real-World Factory Example
In a medium-sized metal components factory, OEE had been calculated manually once a day for several years. At the end of each shift, operators filled in paper reports, in which short stoppages and minor interruptions were often not recorded, and some quality defects were only detected during final inspection. As a result, the reports showed OEE values of 75–80%.
It was only after implementing a real-time automated monitoring system that it became clear the actual efficiency was closer to 55%.
The reason? Most losses occurred during brief, minute-long interruptions caused by machine adjustments and material handling issues – classic “minor stoppages”, which Lean methodology categorises as part of the Six Big Losses. Such events are hard to capture in manual reports, but over the course of a day or week they generate significant costs.
Automation made it possible to identify these sources of loss and address them immediately, resulting in an increase in OEE of several percentage points within just a few months.
While the figures are illustrative, they reflect a typical scenario in plants transitioning from manual reporting to MES-class systems. In such cases, the gap between “reported” and actual OEE can be substantial.
Manual Calculation of OEE
Manual OEE calculation involves operators and production teams collecting data on machine operation, downtime, changeovers, and product quality at the end of each shift, or sometimes only once a week. They then manually fill in reports, and the personnel responsible for analysis calculate the Availability, Performance, and Quality metrics to determine the final OEE.
Although this method may seem straightforward, in practice it comes with significant limitations.
- Short, minute-long stoppages are often not recorded.
- Minor slowdowns or small machine issues can be overlooked.
- Quality data only reaches the reports after final inspection, making OEE a delayed and partially incomplete reflection of actual efficiency.
- Manual data entry is prone to ordinary human errors.
- Time-consuming process – operators must record every interruption accurately, while analysts need to process large volumes of data. This increases the risk of mistakes, delayed decisions, and frustration among teams who see that their effort in reporting does not translate into real improvements.
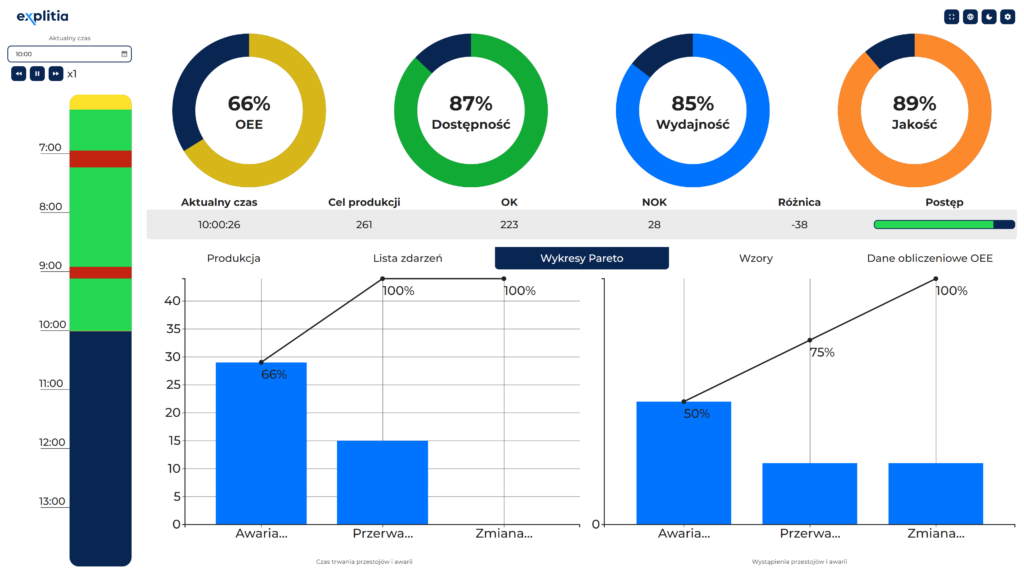
As a result, decisions are often based on incomplete or distorted information. Production schedules, resource allocation, and corrective actions may be misdirected. For example, attention may be focused on minor issues while significant losses remain unnoticed. With such data, conducting a meaningful Pareto analysis is difficult. In practice, this means that even if a report shows OEE at 80%, the actual efficiency of the machines may be significantly lower.
Manual OEE calculation provides some insight into efficiency but rarely reflects the full, real-time reality of production. Consequently, the plant loses development potential and money. This is precisely why an increasing number of factories are turning to automated OEE monitoring.
OEE Automation with the Production Portal
Automating OEE measurement is the step that separates plants that react to problems after the fact from those that can anticipate and eliminate them in real time. A key advantage is that MES systems – such as the Production Portal – collect data directly from machines, PLC controllers, SCADA systems, and additional IoT sensors. This ensures that every cycle, every second of downtime, and every unit produced (or rejected) is immediately captured in the OEE calculation.
Collecting and Integrating Data for OEE
The foundation is full automation of the data flow. PLC controllers provide information on cycle counts, cycle times, and start/stop signals. SCADA systems record process parameters such as temperature, pressure, and flow rates, all of which directly impact quality. Additional IoT sensors monitor machine operating conditions – for example, vibrations, bearing temperature, or energy consumption.
All of this information is fed into the MES layer. Integration with ERP adds a business dimension, allowing production losses to be linked with costs, customer orders, and delays in meeting the production schedule.
Production Portal – OEE Module
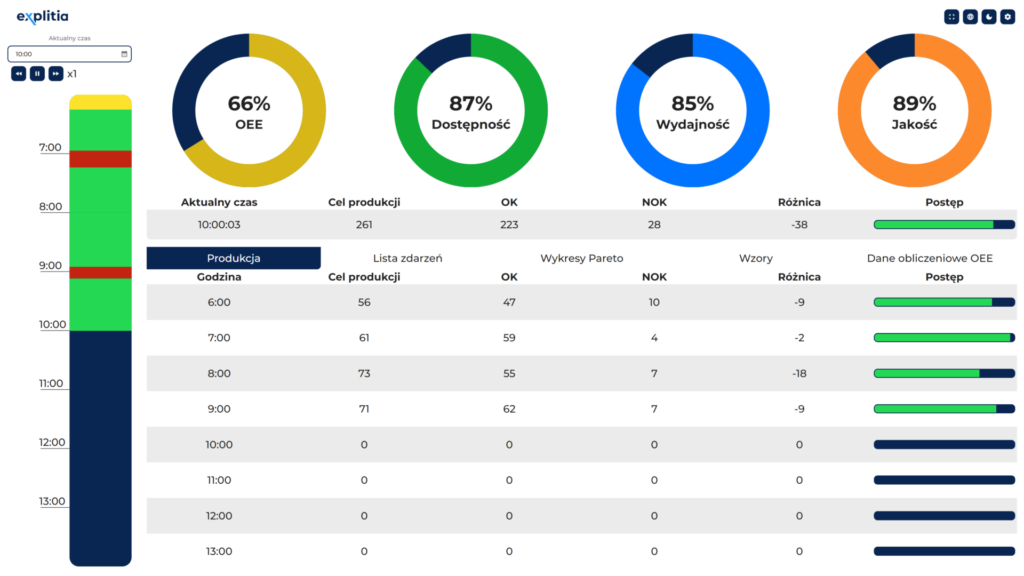
The Production Portal is an MES-class system in which OEE is one of the modules. Data on Availability, Performance, and Quality is recorded in real time and can be displayed to operators on the production line, to managers via dashboards, and to the maintenance department through deviation alerts.
A key feature of the Production Portal is its modular design. Alongside OEE, modules such as SPC (Statistical Process Control) can be enabled to monitor the stability of production processes. This allows not only the recording of quality losses but also the prediction of potential issues based on statistical deviations in process parameters.
This greatly enhances the value of OEE. It does not merely measure performance; it also helps the plant learn to anticipate and prevent problems.
Visualising and Reporting OEE
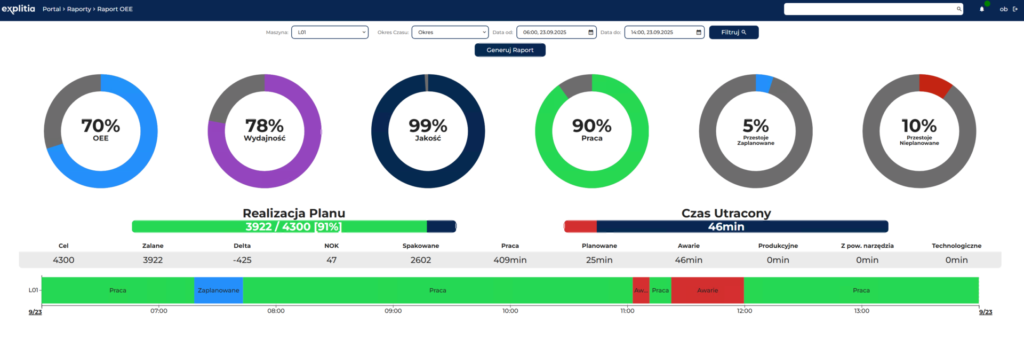
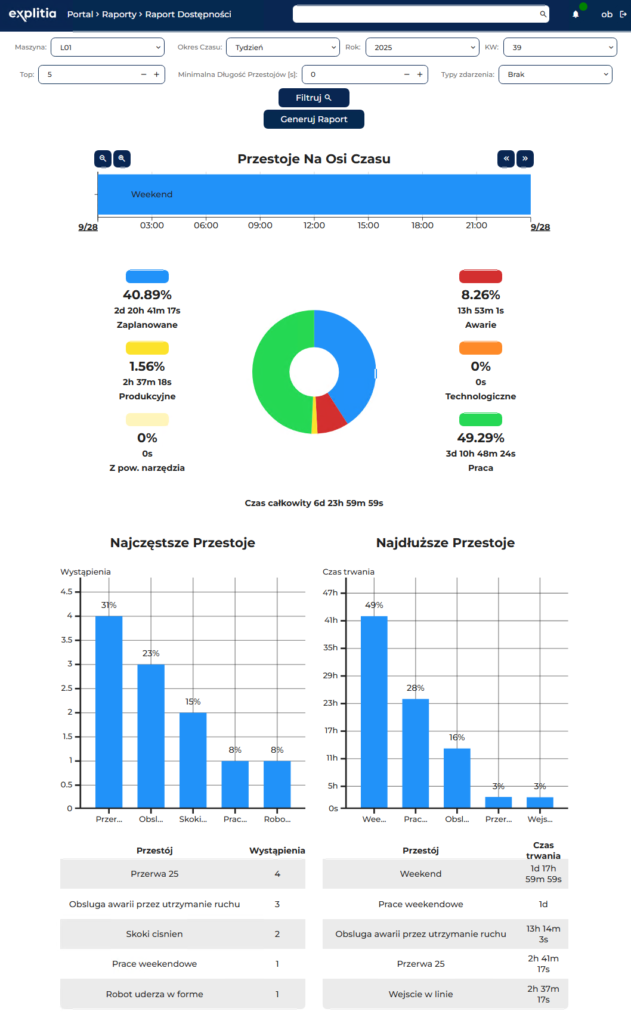
An automated system does far more than collect data. Operators can see in real time how a short stoppage is affecting OEE. Shift managers receive detailed loss reports broken down by category (e.g. changeovers, minor stoppages, breakdowns). Senior management can analyse weekly and monthly trends, and through ERP integration, also understand the real financial costs behind reduced line performance.
Automation transforms OEE from a number seen on paper “the next day” into a constant, practical tool for effective production management. This is why plants implementing MES-class systems (including the Production Portal) achieve higher efficiency in practice and are able to run their operations far more flexibly.
Advantages of Automating OEE
Automated OEE gives manufacturing plants a competitive edge by providing complete and reliable real-time data. Key benefits include:
- Real-Time Event Recording – Every stoppage, minor interruption, or slowdown is immediately captured, eliminating the gaps present in manual reports.
- Accurate Analysis of Changeovers and Losses – The system shows the actual duration and structure of downtime, enabling flexible planning, schedule optimisation, and the implementation of SMED methods.
- Quality Control with the Production Portal’s SPC Module – The SPC module analyses process parameters and signals deviations before they lead to defects, effectively reducing quality losses.
- ERP Integration – OEE becomes a business tool: losses can be translated into costs, and production planning is based on the real capabilities of machines rather than theoretical values.
- Reduced Reporting Errors – Automatically collected data is complete, consistent, and resistant to human error, enabling more accurate decision-making.
- Faster Decision-Making and Planning – Access to up-to-date metrics shortens the decision-making process and allows for better line balancing.
- A Common Reference Point for the Entire Organisation – OEE becomes a single measure that communicates efficiency clearly and allows comparisons across lines, shifts, or plants.
Automating OEE transforms the metric into a reliable decision-making tool, rather than just a table filled out at the end of the day. Real-time data collection eliminates manual errors and reveals the actual sources of loss. This allows a manufacturing plant to focus on actions that genuinely improve efficiency, reduce costs, and enhance quality, rather than on superficial fixes that have no real impact.
Further Reading