SCADA Visualisation – Crafting an Efficient User Interface
SCADA visualisation is a critical component of systems designed to supervise and control manufacturing processes in production facilities. It encompasses all the arrangements established during the design phase and the operational logic of the system. What are the key milestones in implementing SCADA? What should one particularly focus on when creating the interface? Is effective communication between the manufacturing plant and IT company crucial? Read on to find out.
Milestones in SCADA Visualisation Implementation
Continuous Collaboration
Achieving optimal visualisation involves multiple factors. Foremost among these is the collaboration between the design department and the production team during the development of the manufacturing process. This process should also consider unique production stages that require special attention. Visualisation of the process serves as an initial checkpoint for the current state of production. The experience of machine users is essential to highlight the most important elements. Data that are used infrequently should not adversely affect the readability and consistency of the screens. Joint workshops with the IT company create space for developing solutions for intuitive control and parameterisation of complex production processes by less experienced SCADA system users.
Understanding Data
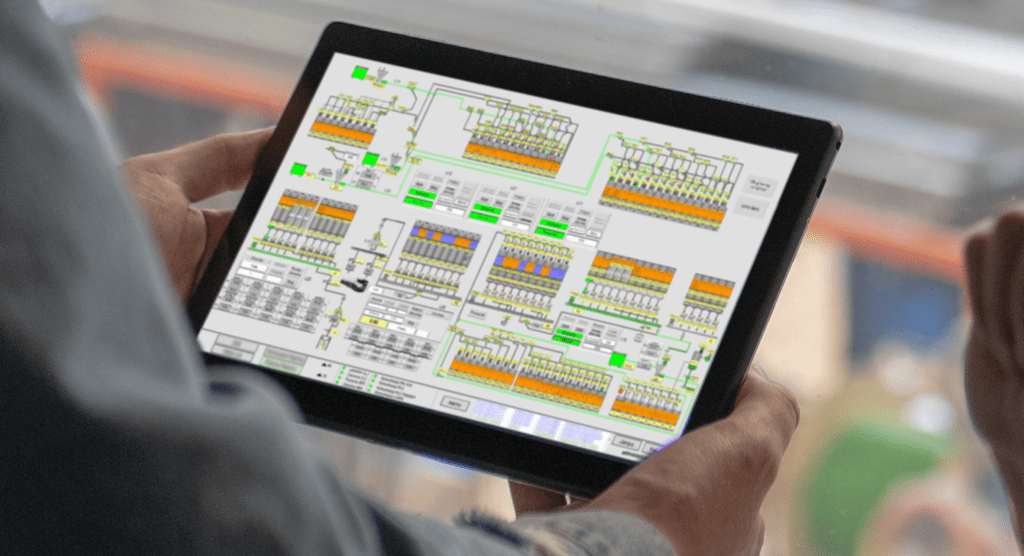
The SCADA system reflects the real manufacturing processes. Regardless of the production facility’s digitisation level, the IT team can develop the necessary tools to capture essential data for the project. A user-friendly graphical interface greatly facilitates remote and secure process control. An IT company with a team of automation specialists can propose proven solutions for integrating data exchange between the SCADA system and the PLC controller, thus creating a coherent system for control, operation, and protection against operator error.
Block Diagram
Together with the client, we create a block diagram representing the first version of the concept. This ensures that the draft meets the expectations of the production facility. SCADA design company should provide comprehensive support in developing the initial version of the scheme. For example, at explitia, we visit the production facility, observe the factory, and request a layout. We tailor our support to the actual needs of each factory.
Important Information – The more information and ideas we obtain from the client, the better the project outcome. Well-thought-out visualisation schemes prove much easier and more effective to implement.
To develop the block diagram, the explitia team needs information about the product, its origin, the conditions of its transport, and the route to its designated destination.
Optimal Data Presentation
Initial discussions about designing the details of a specific solution typically begin with the person reporting the need and then those who will use the visualisation. This helps estimate the structure of the projected graphics. If someone only needs to see a counter, we create a simple window displaying that counter, instead of visualising the entire facility. However, if the user is an operator who needs to control 10 devices, the system should include all these devices. It is crucial to know whether a machine is operational or in failure mode; overlooking any element on the production line can make an alarm status unnoticeable, complicating the operator’s task of identifying the problem.
Multidisciplinary Team
Creating visualisation requires a multidisciplinary team. Our approach to design is not about creating a solution from A to Z and presenting it to the client for approval. Instead, each phase of the work is consulted with the client to address ongoing needs and dispel any doubts. This ensures that the client receives a project that meets their expectations and aligns with their vision. Constant collaboration and dialogue at every project stage help confirm the practicality and quality of solution, allowing for timely corrections. Ultimately, the implemented visualisation is functional and reliable upon launch. Importantly, all preliminary work, before the system goes live, is hosted on our servers without interfering with the existing infrastructure of the facilities.
Optimal SCADA Visualisation – Safe Production
We create visualisations according to a method that minimises human resource involvement, allowing operators to safely initiate the production of product A into its respective tank, thereby reducing the risk of human error. The system thus designed prevents material A from entering a tank containing material B. Only valves and splitters that can receive the contents of a specific tank are opened to ensure such control.
In designing visualisations, it’s important to account for not just current but also historical alarms. A client in the food industry, for example, can review alarm histories for specific areas over the years but also receives immediate updates on current failures. This enables staff to quickly respond to sudden malfunctions, such as those involving splitters or tanks, and facilitates smooth production operations. As is well known, the longer a machine’s downtime, the longer the production process.
Alarms – Efficient Fault Detection
In the design of visualisations, it’s crucial to include not only current but also historical alarms. This approach has been implemented with a client in the food industry. The production facility has the capability to review alarm histories for specific areas over several years, but they also receive immediate updates on current malfunctions. This allows employees to respond swiftly to sudden faults, such as those related to splitters or tanks. Quick error identification supports the smooth operation of production. As it is well understood, the longer a machine remains in disrepair, the longer the production process extends.
10 Steps to Implementing Visualisation
- Site visit to the production facility.
- Creation of a draft that meets the client’s expectations.
- Presentation and acceptance of the first action plan by the explitia team.
- Acceptance of the created project milestone map.
- Design and execution of the first phase of the solution.
- Verification and acceptance of completed actions.
- Further design and internal implementation at explitia.
- Testing and final project implementation.
- Staff training.
- Ongoing cooperation, service, and development of visualisation, adapting to changing needs and conditions.
Implementing effective SCADA visualisation is a process that requires close collaboration, understanding of client needs, and technological expertise. At explitia, we ensure that each of the outlined steps is carried out with utmost care, thus delivering a SCADA visualisation that not only meets expectations but also enhances efficiency and safety in production.
- Are you considering implementing a SCADA system?
- Are you on the brink of digitizing your manufacturing facility?
- Are you in search of a reliable technology partner?
Feel free to get in touch!
Contact us
Do you want to move your production plant to level 4.0? Are you interested in modern solutions for industry in the field of automation and digitisation? Be sure to let us know!

